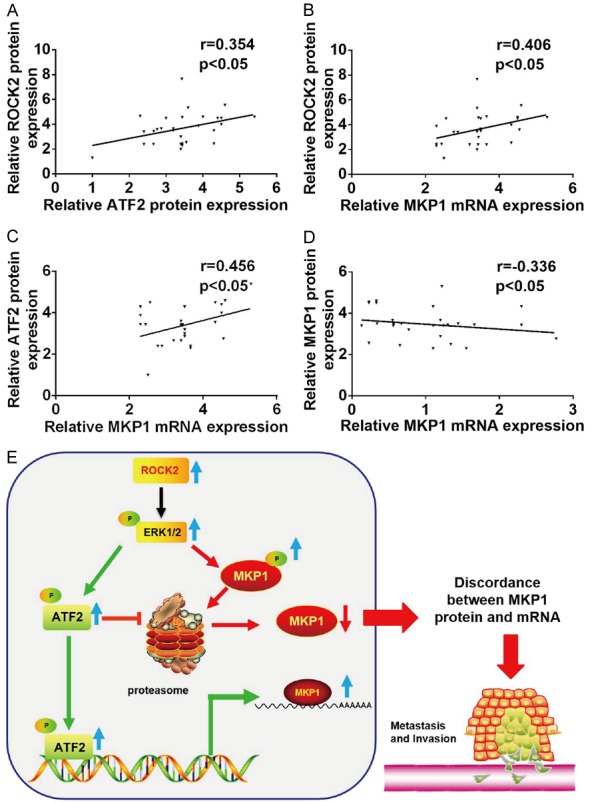
Figure 7.

The relation of expression among ROCK2, ATF2 and MKP1. A. Scatter plots showing the correlation between ROCK2 protein and ATF2 protein expression. B. Scatter plots showing the correlation between ROCK2 protein and MKP1 mRNA expression. C. Scatter plots showing the correlation between ATF2 protein and MKP1 mRNA expression. D. Scatter plots showing the correlation between MKP1 protein and MKP1 mRNA expression. E. Model summarizing the mechanism that ROCK2 disturbs the protein and mRNA level of MKP1 in human HCC progression.
