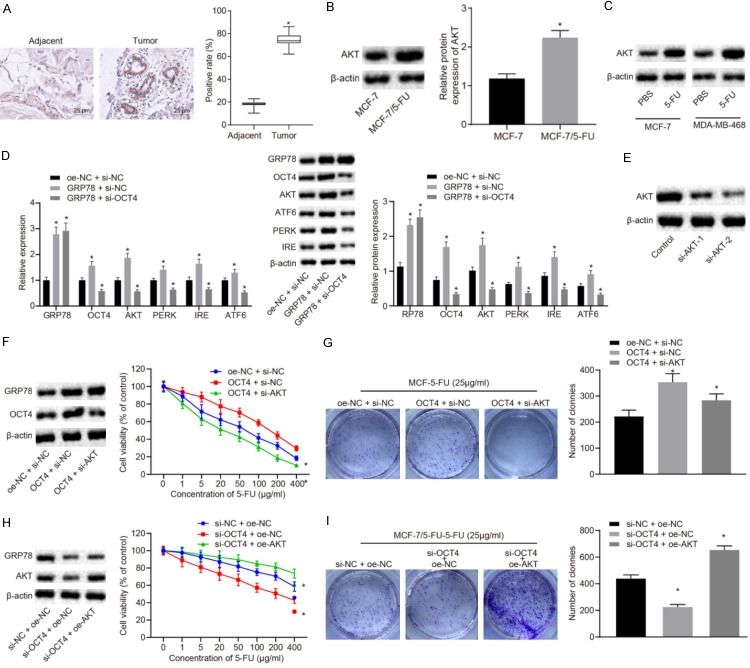
Figure 3.
GRP78 upregulates AKT through increasing OCT4, thereby enhancing resistance of BC cells to 5-FU. A. The expression of AKT in BC tissues and adjacent normal tissues detected by immunohistochemistry (×400). B. The expression of AKT in MCF-7/5-FU and MCF-7 cells measured by Western blot analysis. C. The expression of AKT in MCF-7 and MDA-MB-468 cells after 5-FU treatment. D. The mRNA and protein expression of GRP78, OCT4, AKT, PERK, IRE1 and ATF6 in MCF-7/5-FU cells after GRP78 overexpression with or without the presence of OCT4 silencing. E. Western blot analysis for expression of AKT protein in MCF-7/5-FU cells transfected with si-AKT-1 or si-AKT-2. F. The expression of OCT4 and AKT protein in MCF-7 cells measured by Western blot analysis and sensitivity of MCF-7 cells to 5-FU evaluated by CCK8 assay after transfection with oe-OCT4 with or without the presence of si-AKT. G. The colony formation rate in 5-FU-treated MCF-7 cells after transfection with oe-OCT4 with or without the presence of si-AKT. H. The expression of OCT4 and AKT protein in MCF-7/5-FU cells and sensitivity of MCF-7/5-FU cells to 5-FU after transfection with si-OCT4 with or without the presence of oe-AKT. I. The colony formation rate in MCF-7/5-FU cells after transfection with si-OCT4 with or without the presence of oe-AKT. *P<0.05 vs. adjacent normal tissues, MCF-7 cells, the control group or MCF-7/5-Fu cells treated with oe-NC + si-NC. Measurement data were expressed as mean ± standard deviation. Data in compliance with normal distribution and homogeneity between two groups were compared using t-test. Comparisons among multiple groups were conducted by ANOVA with Tukey’s post-hoc test. Statistical analysis in relation to time-based measurements within each group was realized using repeated measurement ANOVA, followed by a Bonferroni’s post-hoc test for multiple comparisons. The experiment was repeated three times.

