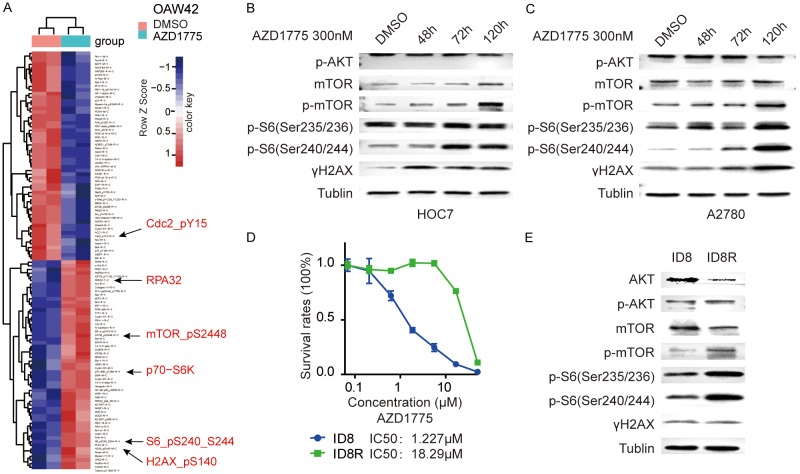
Figure 1.
mTOR pathway is complementary activated after Wee1 inhibition in ovarian cancer cells. A. Heatmap of RPPA data representing “rank-ordered” changes of OAW42 induced by AZD1775. Proteins with consistent decreases (Blue) are on the above and increases (red) are on the bottom of the heatmap. Statistically significant changes (Z scores) indicated boxes. B. Western blot of indicated proteins in HOC7 cells treated with AZD1775 300 nM for the indicated length. C. Western blot of indicated proteins in A2780 cells treated with AZD1775 300 nM for the indicated length. D. Dose-response curves for cell viability effects of ID8 and ID8R (ID8 cells resistance to AZD1775) cells treated with graded concentrations of the AZD1775 for 72 hr. IC50 values for inhibition of viability. E. Western blot of indicated proteins in ID8, ID8R cells.

