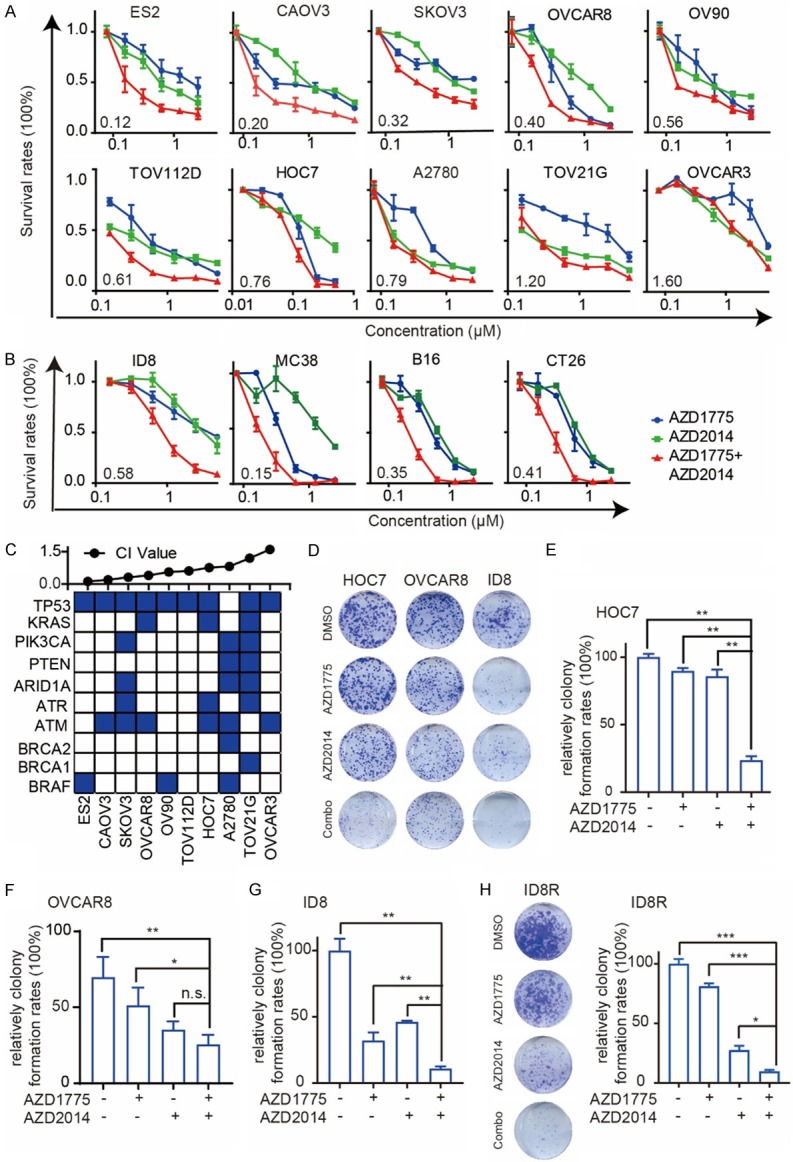
Figure 2.

mTOR and Wee1 inhibition demonstrates synergy in multiple cancer cell lines. A. Dose-response curves of AZD1775 or AZD2014 alone or combined in 10 cancer cell lines treated with graded concentrations of the AZD1775 and AZD2014 for 72 hr. The combination index (CI) was calculated using CalcuSyn software with the Chou-Talalay equation. B. Dose-response curves of AZD1775 or AZD2014 alone or combined in 4 mouse-derived cancer cell lines treated with graded concentrations of the AZD1775 and AZD2014 for 72 hr. The combination index (CI) was calculated using CalcuSyn software with the Chou-Talalay equation. C. Top: CI values; cells were arranged by CI values based on A. Bottom: Selected mutations in cell lines (from CCLE). D. Representative pictures of clonogenic assay in HOC7 (treated with AZD1775 50 nM or AZD2014 50 nM alone or combined), OVCAR8 (treated with AZD1775 50 nM or AZD2014 50 nM alone or combined) and ID8 cells (treated with AZD1775 100 nM or AZD2014 100 nM alone or combined) for 8 days. E. Relative colony formation rates of HOC7 cells are presented as percent relative to Vehicle. Data across studies represent mean ± SD of three independent experiments, Student’s t-test: **P < 0.01. F. Relative colony formation rates of OVCAR8 cells are presented as percent relative to Vehicle. Data across studies represent mean ± SD of three independent experiments, Student’s t-test: n.s as nonsense, *P < 0.05, **P < 0.01. G. Relative colony formation rates of ID8 cells are presented as percent relative to Vehicle. Data across studies represent mean ± SD of three independent experiments, Student’s t-test: **P < 0.01. H. Representative pictures of the clonogenic assay in ID8R cells treated with AZD1775 600 nM or AZD2014 200 nM alone or combined for 8 days (left). Relative colony formation rates of ID8R are presented as percent relative to Vehicle (right). Data across studies represent mean ± SD of three independent experiments, Student’s t-test: *P < 0.05, ***P < 0.001.
