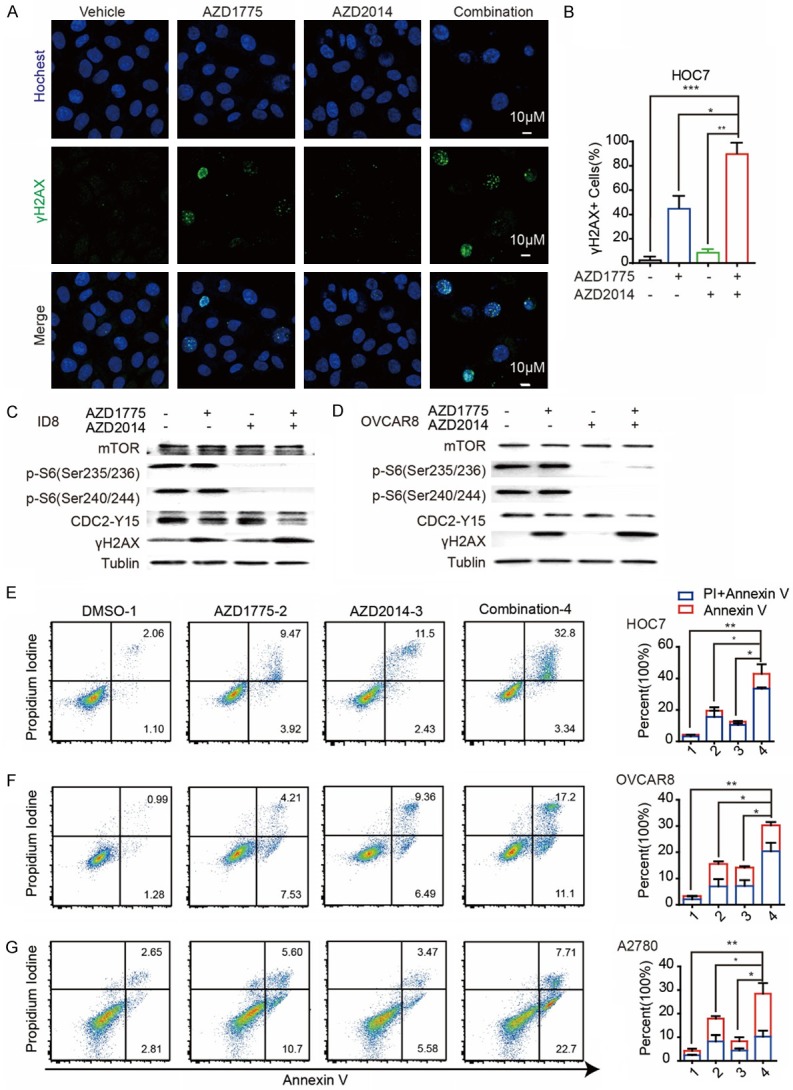
Figure 3.

mTOR and Wee1 inhibition synergistically induces apoptosis and DNA damage in ovarian cancer cells. (A) Representative images of positive cells of Hochest and γH2AX foci in HOC7 cells treated with DMSO, AZD1775 300 nM, AZD2014 300 nM and Combination for 72 hr. Scale bar: 10 μM. (B) Quantification of positive cells of γH2AX in HOC7 cells in (A). (C) Data across studies represent mean ± SD of three independent experiments, Student’s t-test: *P < 0.05, **P < 0.01, ***P < 0.001. (C) Western blotting of indicated proteins in ID8 cells treated with single AZD1775 (800 nM), single AZD2014 (800 nM), or combination for 72 hr. (D) Western blotting of indicated proteins in OVCAR8 cells treated with single AZD1775 (500 nM), single AZD2014 (500 nM), or combination for 72 hr. (E) Flow cytometry results for propidium iodide and annexin V staining in HOC7 cells after exposure to DMSO, single AZD1775 300 nM, AZD2014 300 nM or combination for 48 hr (left). Quantification of propidium iodide and annexin V positive cells in HOC7 cells (right). Data across studies represent mean ± SD of three independent experiments, Student’s t-test: *P < 0.05, **P < 0.01. (F) Flow cytometry results for propidium iodide and annexin V staining in OVCAR8 cells after exposure to DMSO, single AZD1775 400 nM, AZD2014 400 nM or combination for 48 hr (left). Quantification of propidium iodide and annexin V positive cells in OVCAR8 cells (right). Data across studies represent mean ± SD of three independent experiments, Student’s t-test: *P < 0.05, **P < 0.01. (G) Flow cytometry results for propidium iodide and annexin V staining in A2780 cells after exposure to DMSO, single AZD1775 500 nM, AZD2014 500 nM or combination for 48 hr (left). Quantification of propidium iodide and annexin V positive cells in OVCAR8 cells (right). Data across studies represent mean ± SD of three independent experiments, Student’s t-test: *P < 0.05, **P < 0.01.
