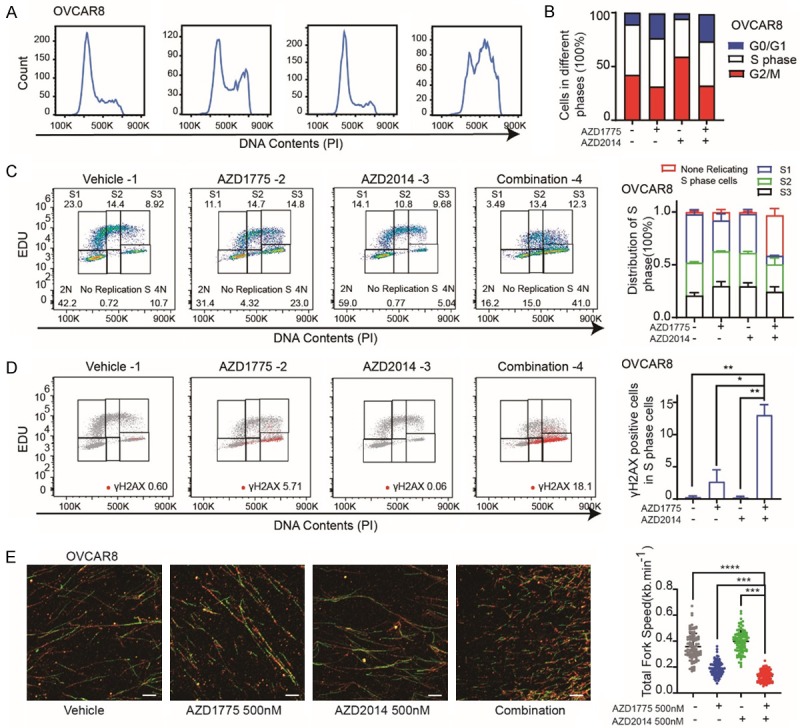
Figure 4.

Dual inhibition of Wee1 and mTOR induces S phase replication stress and triggers DNA damage. A. Representative OVCAR8 cell lines were treated with DMSO, AZD1775 400 nM, AZD2014 400 nM or Combination for 48 hr and analyzed for cell-cycle progression. B. The distribution of cell cycle of OVCAR8 cell lines was treated with DMSO, single AZD1775 400 nM, single AZD2014 400 nM or Combination for 48 hr. C. EDU positive cells FACS analysis of the cell cycle distribution of OVCAR8 cells after exposure to DMSO, single AZD1775 (400 nM), single AZD2014 (400 nM) or Combination for 48 hr (left). Quantification and distribution of S1, S2, S3 and no replicated S phase cells in the OVCAR8 cells (right). D. γH2AX positive cells FACS analysis of the cell cycle distribution of OVCAR8 cells after exposure to DMSO, single AZD1775 (400 nM), single AZD2014 (400 nM) or Combination for 48 hr (left). Quantification of γH2AX positive cells in the S phase of OVCAR8 cells (right). Student’s t-test: *P < 0.05, **P < 0.01. E. OVCAR8 cells were treated with DMSO, single AZD1775 (400 nM), single AZD2014 (400 nM) or Combination for 24 hr subjected to DNA fiber analysis (left), scale bars, 10 μM. Mean fork speed (kb/min) is indicated (right), quantification of 100 fibers in each group, Student’s t-test: ***P < 0.001, ****P < 0.0001.
