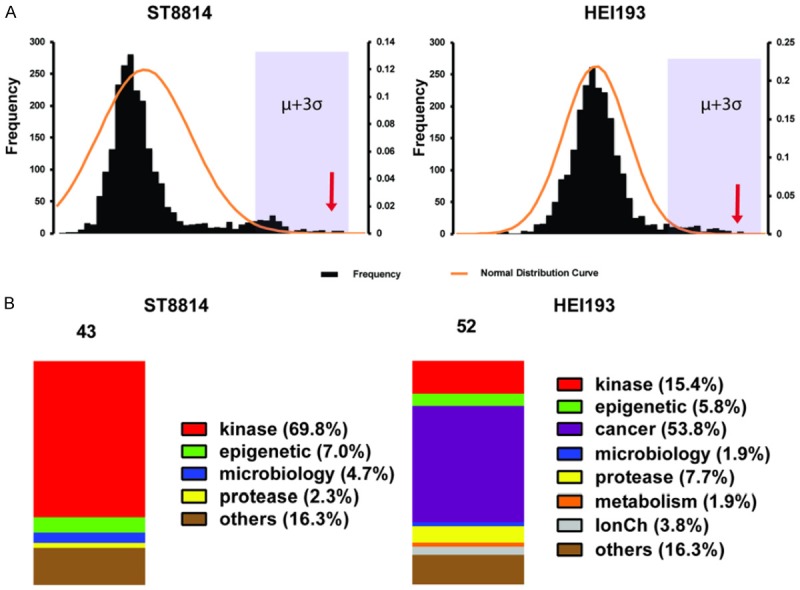
Figure 1.

PLK1 inhibitors identified in a 2240 compound screen in NF1 (ST88-14) and NF2 (HEI-193) cells. (A) NF1 (left) and NF2 (right) cell line Z score distribution, Z scores higher than μ+3σ are presented in (B). μ, mean of Z scores; σ, standard deviation of Z scores. Arrows indicate where most PLK1 drugs ranked. (B) Category distribution of the top-ranked inhibitors according to a cut-off value of μ+3σ. Left, NF1; right, NF2.
