
Figure 2.
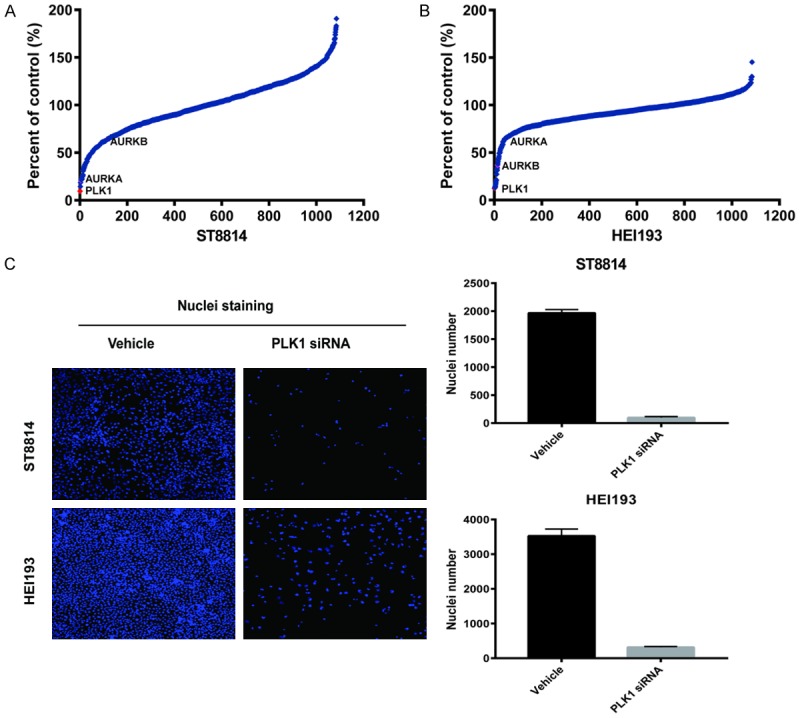
siRNA screen of NF1 (ST88-14) and NF2 (HEI-193) cells. Cell Viability of siRNA transfected cells was measured by counting Hoechst stained nuclei 72 hours post-transfection. (A and B) Z-score plots of siRNA knockdown in ST88-14 (A) and HEI-193 (B). The relative ranking of PLK1, AURKA, and AURKB kinases are indicated. (C) Representative images of nuclei from cells transfected with NegC and PLK1 siRNA. Right side graphs demonstrate the number of nuclei counted between NegC and PLK1 siRNA transfections.