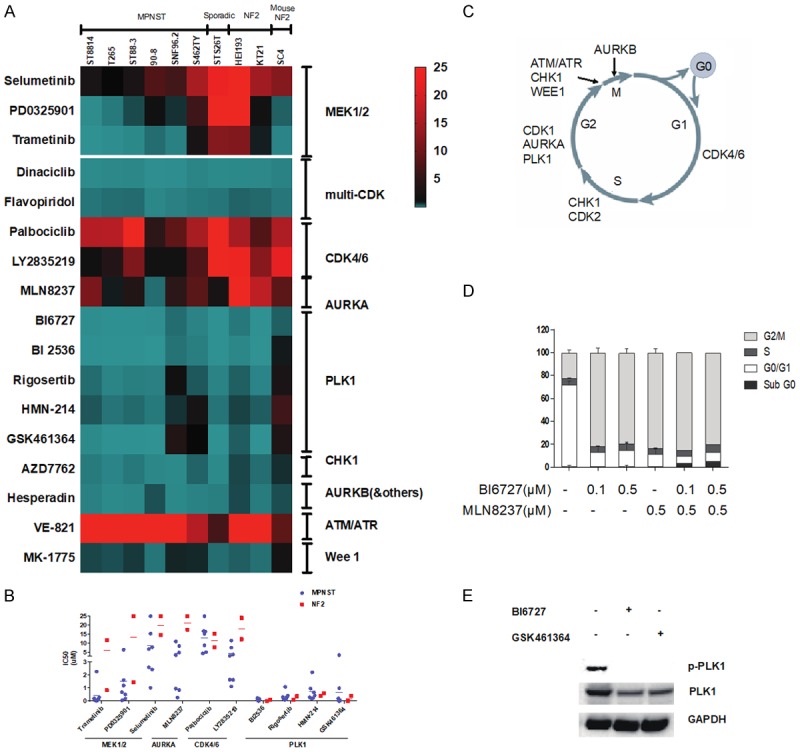
Figure 5.

High throughput profiling of PLK1, AURKA and MEK1/2 inhibitors. (A) Eight concentrations of each drug were tested, and the data are expressed as a heat map of the IC50s. (B) IC50s of selected drugs were replotted. For this analysis only human cell lines were included that were derived from NF1 and NF2 patients. (C) The cell cycle kinases profiled against neurofibromatosis cells in (A). (D) Flow cytometry analysis of the effect of PLK1 inhibitor BI6727 and the Aurora Kinase inhibitor, MLN8237 using propidium iodide DNA staining. Cells were treated for 24 hours. The histogram shows the percentage of cells in different phases of the cell cycle. (E) ST8814 cells were synchronized by thymidine (2.5 mM, 24 h) treatment followed by washed with PBS and incubated for 18 h in fresh medium supplemented with nocodazole (1 μg/mL) to arrest cells in mitosis. Cells were treated with 10 μmol/L of BI6727 and 10 μmol/L of GSK461634 for 24 h and then harvested. A western blot was probed for p-PLK1, total PLK1, and GAPDH.
