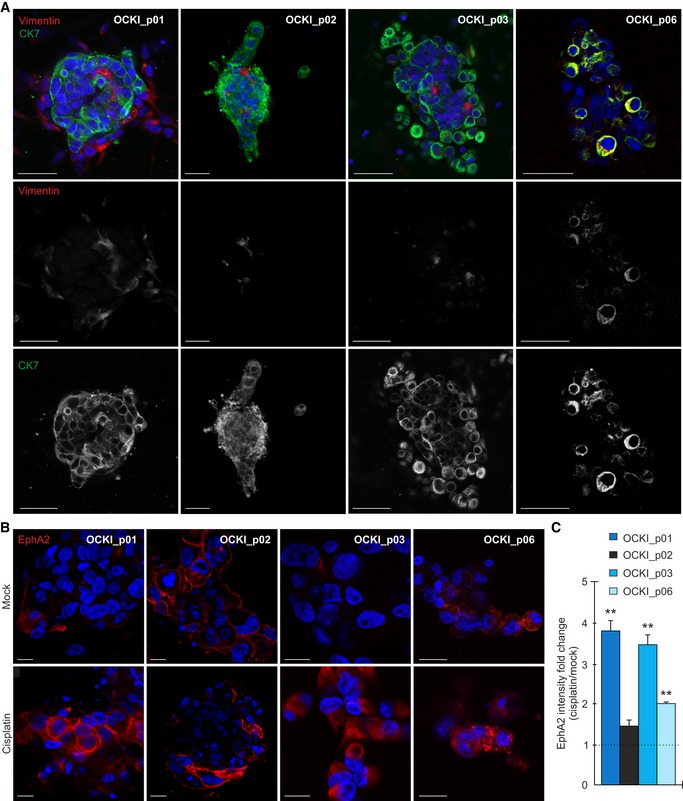
Figure 1. Cisplatin treatment leads to EphA2 upregulation in ex vivo HGSC cultures.

-
AConfocal micrographs show cytokeratin 7 (CK7, green) and vimentin (red) in patient‐derived HGSC cells cultured in 3D collagen for 7 days. Scale bars: 50 μm.
-
BConfocal micrographs of EphA2 (red) in HGSC cells cultured in 3D collagen for 7 days and treated for 72 h with 10 μM cisplatin (5 μM for OCKI_p01). The intensity of EphA2 is comparable only between mock and treatment conditions for each patient. Scale bars: 20 μm.
-
CChart illustrates EphA2 fold change after treatment. Mock is set to one. N = 3.
