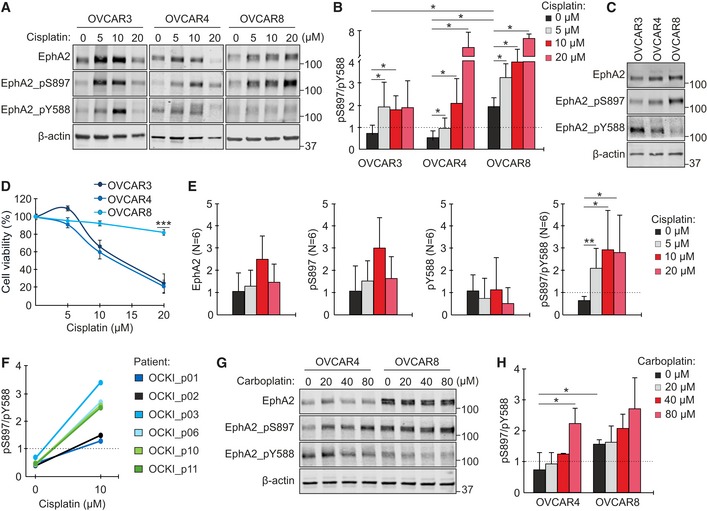
Figure 2. OC cell lines and patient‐derived cells undergo an EphA2 phosphorylation switch upon platinum treatment.

-
A, BEphA2 (total and phosphorylated at S897 or Y588) in OVCAR3, OVCAR4, and OVCAR8 after treatment with 0–20 μM cisplatin for 72 h was assessed by immunoblotting (A) and quantified for pS897/pY588 ratio (B). N = 4.
-
CEphA2 (total and phosphorylated) in corresponding untreated cells. The same β‐actin detection for these samples is shown in Appendix Fig S1B.
-
DCytotoxicity assay results after cell treatment with 0–20 μM cisplatin for 72 h. N = 6.
-
EQuantitative assessment of EphA2 (total and phosphorylated) and pS897/pY588 ratio in early passage patient‐derived HGSC cultures treated with 0–20 μM cisplatin for 72 h (see immunoblots in Appendix Fig S2A). N = 6 patients, pooled.
-
FCorresponding EphA2 pS897/pY588 ratios for individual patient cells.
-
G, HEphA2 (total and phosphorylated) in OVCAR4 and OVCAR8 after treatment with 0–80 μM carboplatin for 72 h (G) along with pS897/pY588 quantification (H). N = 3.
