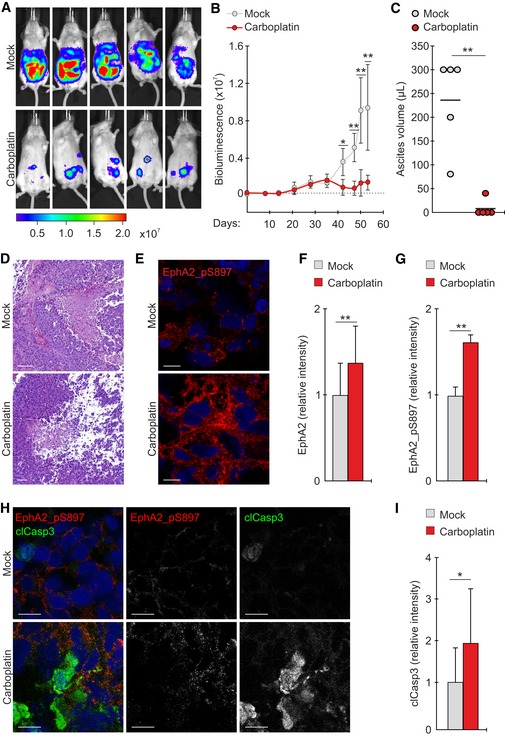
Figure 3. Platinum treatment promotes ligand‐independent oncogenic EphA2 phosphorylation in vivo .

-
ABioluminescence images visualize mock‐ and carboplatin‐treated OVCAR4 xenograft tumors (day 53; after 13‐d i.p. treatment). Color scale unit: p/sec/cm2/sr.
-
B, CCharts illustrate the tumor growth (B) and ascites volumes at the end of the follow‐up (C). Carboplatin treatment started on day 35. Bioluminescent unit: p/sec/cm2/sr. N = 5 mice/group.
-
D, ERepresentative micrographs of hematoxylin–eosin staining (D) and EphA2‐pS897 immunofluorescence (E) in the xenografts tumors. Scale bars: 100 μm (D), 10 μm (E).
-
F, GQuantitative assessment of tumor EphA2 (F) and EphA2‐pS897 (G). N = 5 mice/group.
-
H, IConfocal micrographs of tumor EphA2‐pS897 (red) and cleaved caspase‐3 (H; clCasp3, green) and corresponding clCasp3 quantification (I). Scale bars: 20 μm. N = 5 mice/group.
