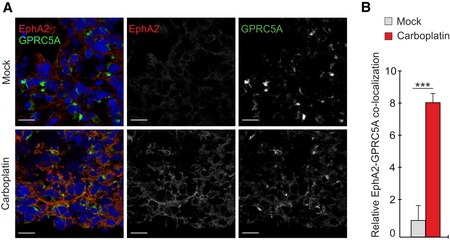
Figure EV4. Co‐localization of GPRC5A and EphA2 is induced upon platinum treatment in vivo .

-
A, BRepresentative confocal micrographs (A) of EphA2 (red) and GPRC5A (green) and corresponding co‐localization quantification (B) in OVCAR4 xenograft tumors of mock and carboplatin‐treated mice. N = 5 mice/group. Scale bars: 20 μm.
