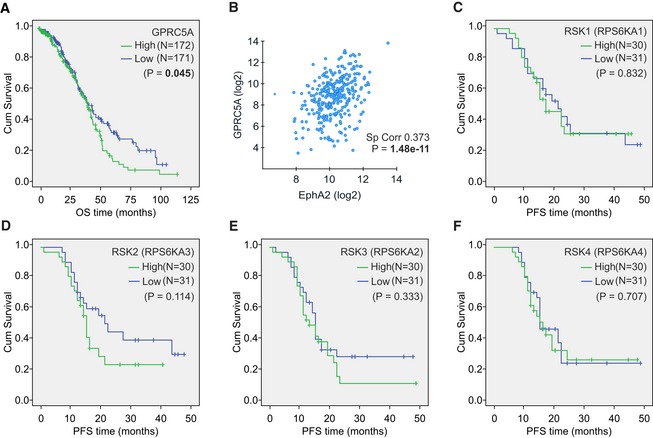
Figure EV5. GPRC5A is co‐expressed with EphA2 and associates with worse survival of OC patients.

-
AKaplan–Meier survival curve illustrates the overall survival (OS) of patients with high or low (top 40% vs. bottom 40%) GPRC5A mRNA expression. Mean OS was 46 months for GPRC5Ahigh vs. 56 months for GPRC5Alow.
-
BScatter plot illustrates the correlation of EphA2 and GPRC5A mRNA in OC (using TCGA by cBioPortal for Cancer Genomics).
-
C–FKaplan–Meier survival curves illustrate the progression‐free survival (PFS) of patients with high or low (top 25% vs. bottom 25%) RSK1 (RPS6KA1; C), RSK2 (RPS6KA3; D), RSK3 (RPS6KA2; E), and RSK4 (RPS6KA4; F) mRNA expression. No significant differences in PFS were observed in these survival analyses.
