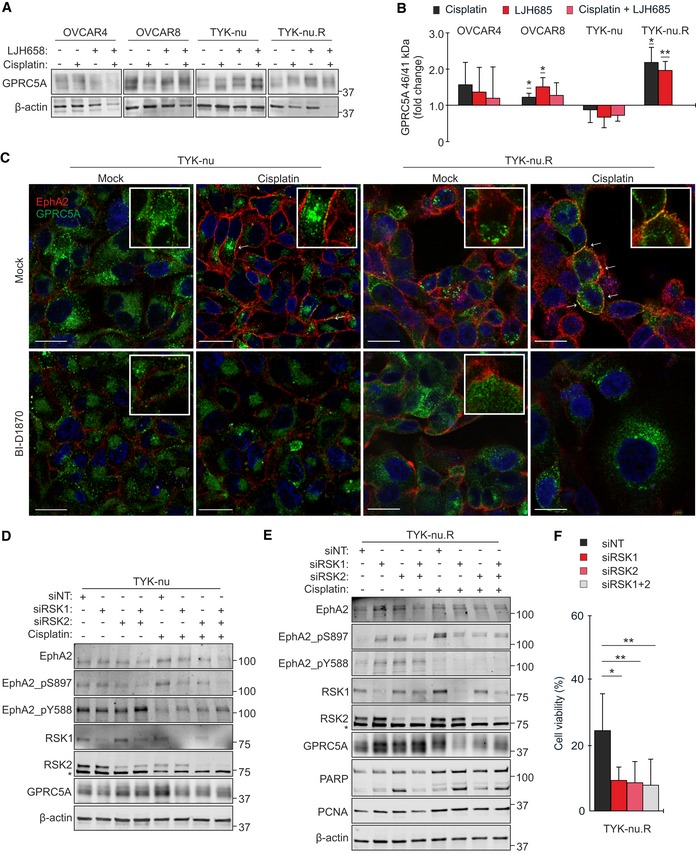
Figure 6. GPRC5A regulation defines OC cell responses to RSK1/2‐EphA2‐pS897 inhibition.

-
A, BImmunoblot images (A) and quantification (B) show GPRC5A 46/41 kDa ratios in OC cells treated with 0–10 µM cisplatin and with 25 µM LJH685 alone or as a combination for 72 h. The ratio in mock cells was set to 1. N = 4.
-
CConfocal micrographs of EphA2 (red) and GPRC5A (green) in TYK‐nu and TYK‐nu.R treated with 5 µM cisplatin and 10 μM LJH685 as indicated for 72 h. Arrows point co‐localization of the receptors. Scale bars: 20 μm.
-
D, EEphA2 (total and phosphorylated), RSK1/2, and GPRC5A in TYK‐nu (D) and these proteins coupled with PARP and PCNA in TYK‐nu.R (E) were assessed by immunoblotting after RSK1/2 knockdown for 2 days and following treatment with 0–5 μM cisplatin for 72 h. Asterisks indicate unspecific bands.
-
FChart illustrates the viability of the RSK1/2‐depleted TYK‐nu.R after cisplatin treatment. N = 3.
