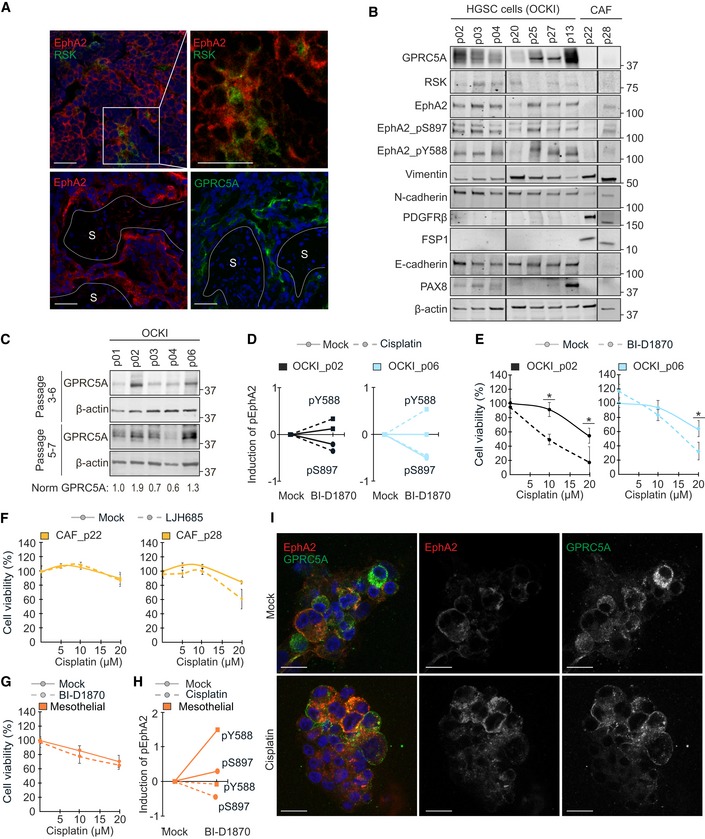
Figure 8. RSK‐EphA2‐pS897 inhibition specifically sensitizes GPRC5Ahigh HGSC cells to platinum chemotherapy.

-
ARepresentative confocal micrographs show EphA2 (red), RSK (green: top), and GPRC5A (green: bottom) in frozen sections of HGSC patient tumors. S indicates the stroma. Scale bars: 50 μm.
-
BIndicated proteins and EphA2 phosphorylation were assessed by immunoblotting in patient‐derived HGSC cells and CAFs.
-
CGPRC5A in earlier (top) and later passage (bottom) HGSC cells. See normalized GPRC5A relative to OCKI_p01 below the immunoblot images.
-
DCharts illustrate EphA2‐pS897 inhibition (circles) and EphA2‐pY588 increase (squares) by 10 µM BI‐D1870 alone (unbroken line) or in combination with 0–10 µM cisplatin (dotted line) in the GPRC5Ahigh HGSC cells. See Appendix Fig S7B for immunoblots.
-
ECell viability of the GPRC5Ahigh OCKI_p02 and OCKI_p06 after treatment with a combination of 0–20 µM cisplatin and 10 µM BI‐D1870 for 72 h. N = 3.
-
F, GCell viability upon 72‐h combinatorial treatment with 0–20 µM cisplatin and 25 µM LJH685 in patient‐derived CAFs (F; N = 3) and 10 µM BI‐D1870 in mesothelial cells (G; N = 3).
-
HChart illustrates the changes in EphA2‐pS897 and EphA2‐pY588 by BI‐D1870 alone and with cisplatin in mesothelial cells. Upon combination with 10 µM cisplatin for 72 h, 10 µM BI‐D1870 decreased EphA2‐pS897 and EphA2‐pY588. See Appendix Fig S7J for immunoblot.
-
IConfocal micrographs of EphA2 (red) and GPRC5A (green) in primary OCKI_p06 patient cells cultured in 3D collagen for 4 days before 72‐h treatment with or without 10 µM cisplatin. Scale bars: 20 μm.
