-
A
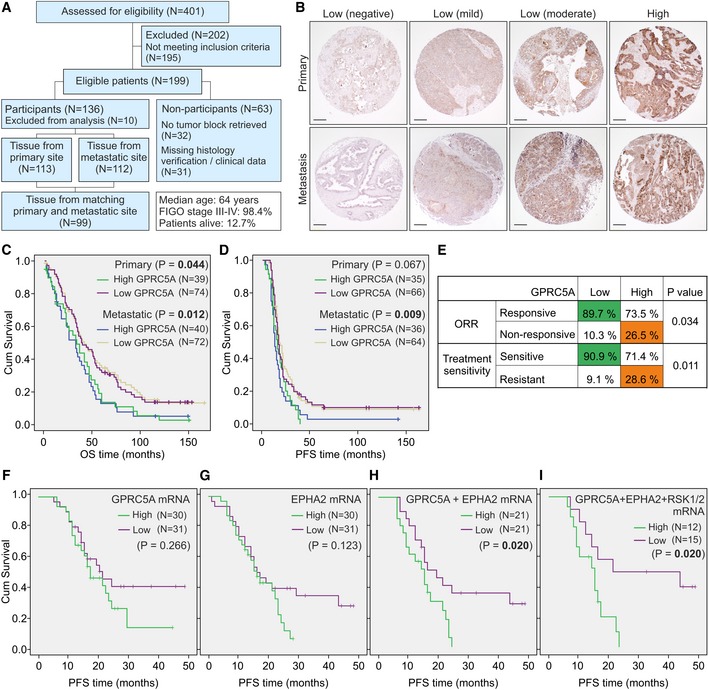
Flow diagram of patients for the HGSC TMA.
-
B
Representative immunostainings for GPRC5A scoring in HGSC primary and metastatic tumors. For maximum intensity scores, an optical 4‐point scale (0: negative, 1: mild, 2: moderate, and 3: high) was used. For survival analyses, a 2‐point scale (low: scores 0–2 and high: score 3) was used. Scale bars: 200 μm.
-
C, D
Kaplan–Meier survival curves illustrate the overall (OS) and progression‐free (PFS) survival of patients with high or low GPRC5A. In primary tumors, mean OS for GPRC5Ahigh was 39 months vs. 56 months for GPRC5Alow (C). In patients with metastatic tumors, mean OS for GPRC5Ahigh was 37 months vs. 60 months for GPRC5Alow. Mean PFS in metastatic tumors was 20 months for GPRC5Ahigh vs. 35 months for GPRC5Alow (D). No significant difference in mean PFS in primary tumors.
-
E
Correlation of maximum GPRC5A intensity with objective response rate (ORR) and treatment sensitivity (platinum alone or in combination with taxane).
-
F–I
Kaplan–Meier survival estimates for the PFS of patients with high or low (top 25% vs. bottom 25%) GPRC5A (F), EPHA2 (G), GPRC5A + EPHA2 (H), and GPRC5A + EPHA2 + RSK1(RPS6KA1) + RSK2(RPS6KA3)‐combined (I) mRNA expression. Mean PFS for GPRC5A + EPHA2high was 15 months vs. 26 months for GPRC5A + EPHA2low (H). Mean PFS for GPRC5A + EPHA2 + RPS6KA1/3high was 14 months vs. 31 months for GPRC5A + EPHA2 + RPS6KA1/3low (I).
Data information: In (C, D and F–I), logrank test was used. In (E), Pearson chi‐square test was used.

