-
A
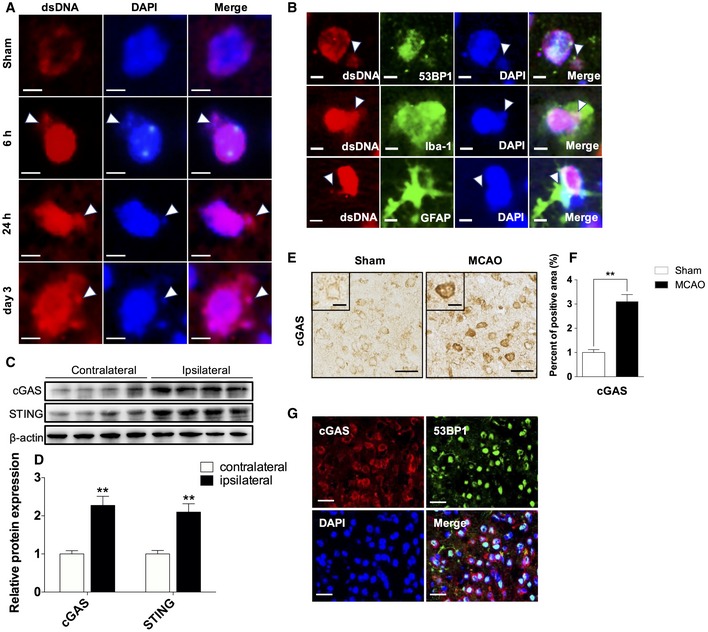
Representative single immunofluorescent staining for dsDNA at 6, 24 h, and 3 days of reperfusion after MCAO in the penumbra as well as in the sham brain, arrowheads indicate disintegration of the nucleus. Scale bars, 5 μm.
-
B
Representative images of double immunofluorescent staining for 53BP‐1 and dsDNA (upper panel), Iba‐1 and dsDNA (middle panel), and for GFAP and dsDNA (lower panel), arrowheads indicate cytoplasmic dsDNA. Scale bars, 5 μm.
-
C
Western blot analysis of cGAS and STING using lysates prepared from the indicated tissues of mouse brain following MCAO.
-
D
Quantitative analysis for Western blot analysis. n = 6 mice per group. **P < 0.01, two‐tailed unpaired Student's t‐test.
-
E
Immunohistochemical staining for cGAS at 3 days of reperfusion after tMCAO in peri‐ischemic area as well as in the corresponding regions of sham control brains. Scale bars, 50, 20 μm in insets.
-
F
Quantitative analysis of cGAS immunohistochemical staining. n = 6 mice per group. **P < 0.01, two‐tailed unpaired Student's t‐test.
-
G
Representative double immunofluorescent stainings for cGAS (red) and 53BP1 (green). n = 6 mice per group. Scale bars, 50 μm.
Data information: Data are presented as mean ± SEM.
.

