-
A
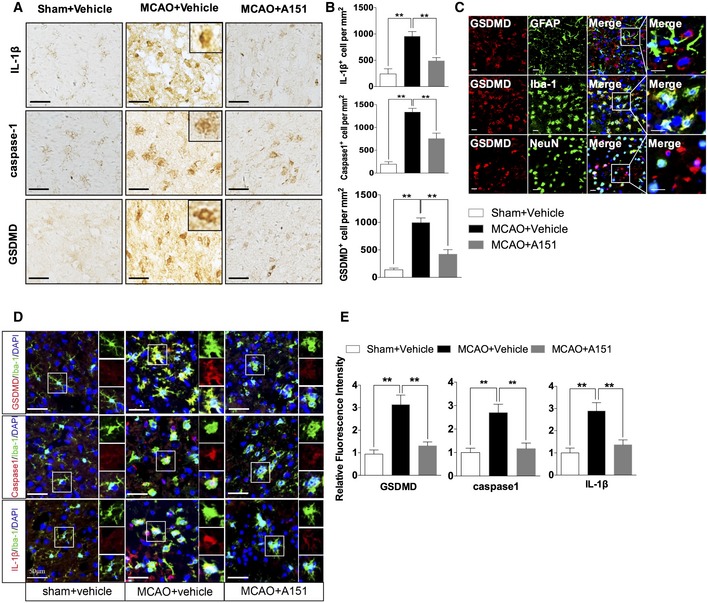
Representative images of immunohistochemical staining of IL‐1β, caspase‐1, and GSDMD in the brains of indicated group. Scale bars, 50 μm.
-
B
Quantitative analysis for immunohistochemical staining. n = 6 mice per group. **P < 0.01, one‐way ANOVA followed by Tukey post hoc test.
-
C
Representative images of double immunofluorescent staining for GFAP and GSDMD, for Iba‐1 and GSDMD, and for NeuN and GSDMD in post‐ischemic brains after tMCAO. Scale bars, 20 μm.
-
D
Representative images of double immunofluorescent staining for Iba‐1 and GSDMD, for Iba‐1 and caspase‐1, and for Iba‐1 and IL‐1β of sham+vehicle, MCAO+vehicle, and MCAO+A151 groups. Scale bars, 50 μm.
-
E
Bar graph shows the relative immunofluorescence intensity of GSDMD, caspase‐1, and IL‐1β in the brains of indicated groups. n = 6 mice per group. **P < 0.01, one‐way ANOVA followed by Tukey post hoc test. DAPI staining: nuclei.
Data information: Data are presented as mean ± SEM.
.

