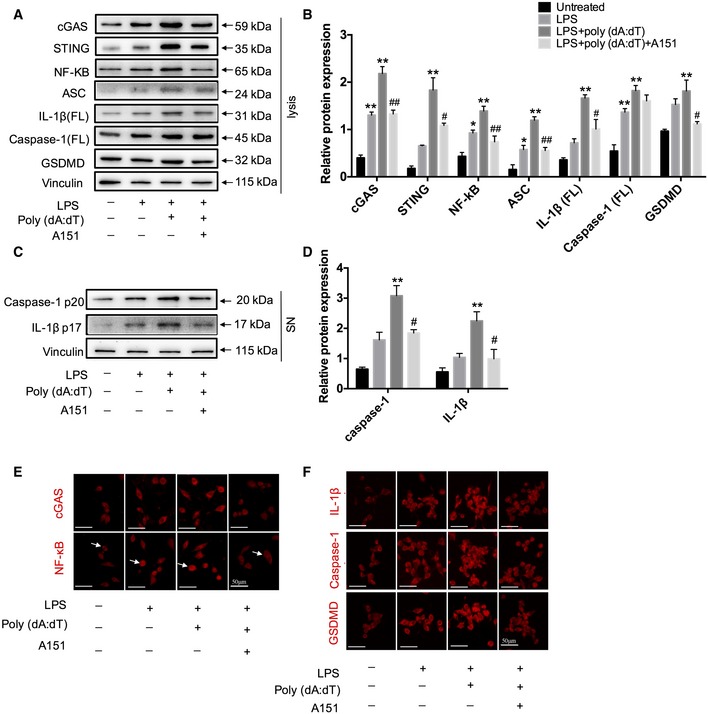
Figure 4. A151 alleviates cGAS activity and expression of pyroptosis‐associated proteins in vitro.

-
AExpression of cGAS, STING, NF‐κB, ASC, IL‐1β (FL), caspase‐1 (FL), and GSDMD in primary microglia lysates was detected using Western blot.
-
BQuantitative analysis for Western blot analysis of cGAS, STING, NF‐κB, ASC, IL‐1β (FL), caspase‐1, and GSDMD. n = 3 per group. P‐values are reported in Appendix Table S3, one‐way ANOVA followed by Tukey post hoc test. *P < 0.05, **P < 0.01 compared with the untreated group, # P < 0.05, ## P < 0.01 compared with the LPS+poly(dA:dT) group.
-
CThe protein levels of caspase‐1 p20 and IL‐1β (p17) in the supernatant of cultured primary microglia were determined by Western blot.
-
DQuantitative analysis for Western blot analysis of caspase‐1 and IL‐1β. n = 3 per group. P‐values are reported in Appendix Table S3, one‐way ANOVA followed by Tukey post hoc test. **P < 0.01 compared with the untreated group, # P < 0.05 compared with the LPS+poly(dA:dT) group.
-
E, FImmunofluorescence was conducted to detect the expression levels of cGAS, NF‐κB (arrows indicate NF‐κB translocation), and pyroptosis‐associated molecules (GSDMD, caspase‐1, and IL‐1β) in BV2 cells. n = 3 in each group. Scale bars, 50 μm.
