-
A
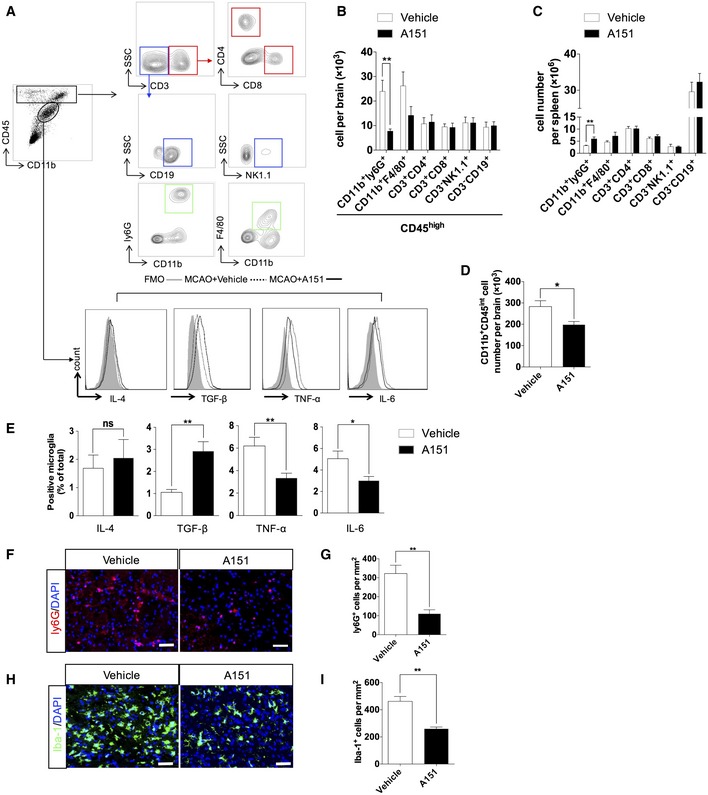
Gating strategy of brain‐infiltrating immune cells including CD4+ T cells (CD3+ CD4+), CD8+ T cells (CD3+CD8+), B cells (CD3−CD19+), NK cells (CD3−NK1.1+), monocyte/macrophages (CD11b+CD45highF4/80+), neutrophils (CD11b+CD45highLy6G+), and microglia (CD11b+CD45int) and their expression of IL (interleukin)‐6, TNF‐α (tumor necrosis factor‐α), TGF‐β (transforming growth factor‐β), and IL‐4. FMO, fluorescence minus one.
-
B
Quantitative analysis of the counts of brain‐infiltrating leukocytes in the brains of MCAO mice receiving indicated treatment. n = 6 mice per group. **P < 0.01, two‐tailed unpaired Student's t‐test.
-
C
Bar graph shows counts of leukocyte subtype in the spleens of MCAO mice receiving indicated treatment. n = 6 mice per group. **P < 0.01, two‐tailed unpaired Student's t‐test.
-
D
Quantitative analysis of the microglia in the brains of MCAO mice receiving indicated treatment. n = 6 mice per group. *P < 0.05, two‐tailed unpaired Student's t‐test.
-
E
Bar graph shows percentages of microglia expressing IL‐6, TNF‐α, TGF‐β, and IL‐10 in the brains of MCAO mice receiving indicated treatment. n = 6 mice per group. *P < 0.05, **P < 0.01, two‐tailed unpaired Student's t‐test.
-
F
Representative images of immunofluorescent staining for ly6G in peri‐infarct areas of MCAO mice receiving indicated treatment. Scale bar, 50 μm.
-
G
Bar graph shows the number of ly6G+ neutrophils. n = 6 mice per group. **P < 0.01, two‐tailed unpaired Student's t‐test.
-
H
Representative images of immunofluorescent staining for Iba‐1 in peri‐infarct areas of MCAO mice receiving indicated treatment. Scale bar, 50 μm.
-
I
Bar graph shows the number of Iba‐1+ microglia. n = 6 mice per group. **P < 0.01, two‐tailed unpaired Student's t‐test.
Data information: Data are presented as mean ± SEM.
.

