
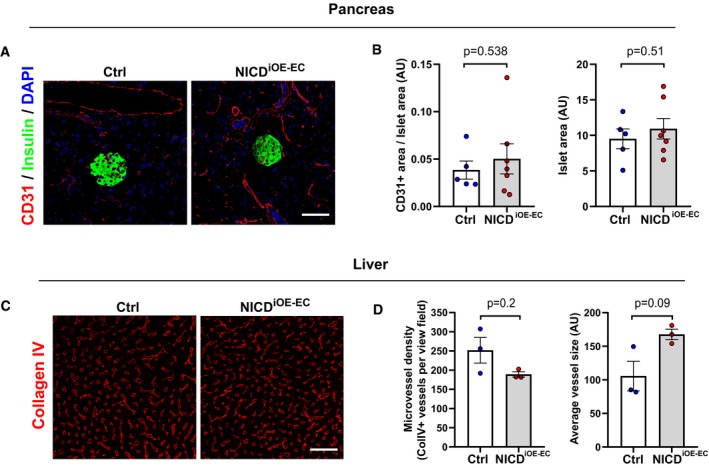
Figure EV2. Pancreas and liver vasculature in NICD i OE ‐ EC mice.
-
ARepresentative confocal images showing CD31+ blood vessels (red) and insulin‐positive (green) islets in pancreas sections from NICDiOE‐EC mice and littermate controls 5 weeks after tamoxifen injection. Scale bar 50 μm.
-
BQuantification of blood vessel and islet area in control (n = 5) and NICDiOE‐EC (n = 7) mice. Data represent mean ± SEM, unpaired t‐test.
-
CRepresentative confocal images showing collagen IV+ blood vessels (red) in liver sections from NICDiOE‐EC mice and littermate controls 5 weeks after tamoxifen injection. Scale bar 50 μm.
-
DQuantification of microvessel density and average vessel size in control (n = 3) and NICDiOE‐EC (n = 3) mice. Data represent mean ± SEM, Mann–Whitney, and Welch's t‐test.