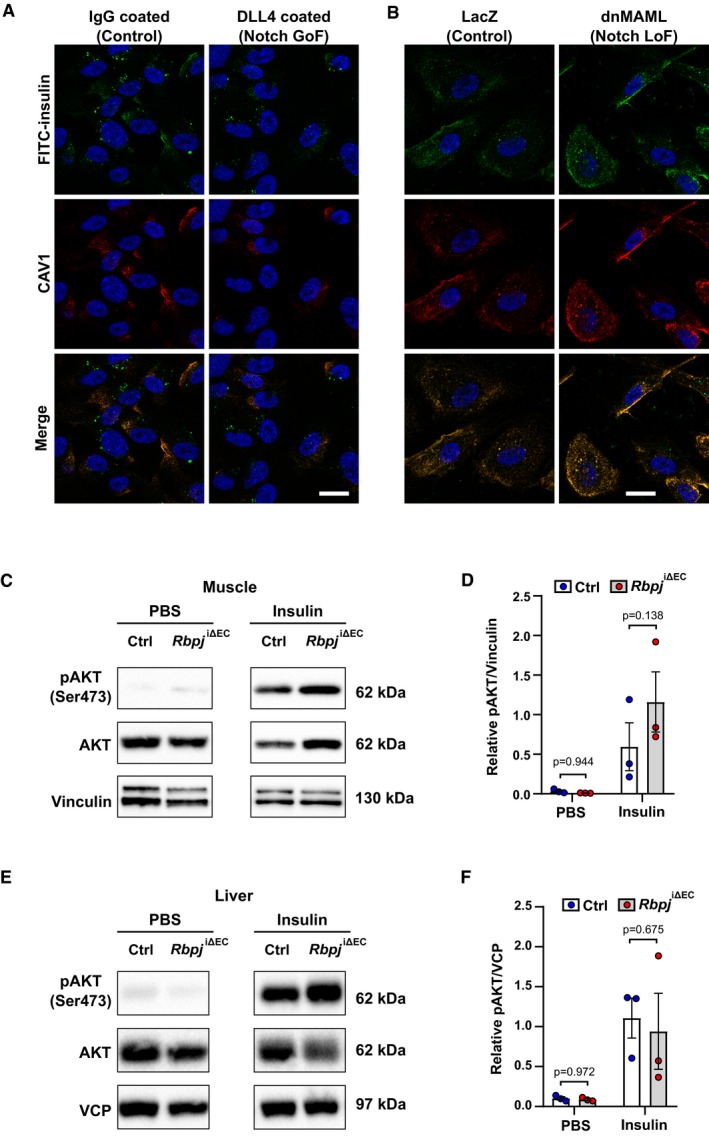
Figure 3. Loss of Notch signaling improves endothelial insulin transport.

-
AUptake of FITC insulin and CAV1 expression in primary human umbilical venous ECs (HUVECs) upon Notch induction. Scale bar 20 μm.
-
BUptake of FITC insulin and CAV1 expression in (HUVECs) upon Notch blockage. Scale bar 20 μm.
-
CRepresentative Western blot of AKT phosphorylation in gastrocnemius muscle 7 min after intravenous injection of PBS or 1.5 U/kg insulin in control (n = 3) and Rbpj i∆EC (n = 3) mice 5 weeks after recombination.
-
DDensitometric analysis of Western blot in (C). n = 3, data represent mean ± SEM, unpaired t‐test.
-
ERepresentative Western blot of AKT phosphorylation in liver 7 min after intravenous injection of PBS or 1.5 U/kg insulin in control (n = 3) and Rbpj i∆EC (n = 3) mice 5 weeks after recombination.
-
FDensitometric analysis of Western blot in (E). n = 3, data represent mean ± SEM, unpaired t‐test.
Source data are available online for this figure.
