
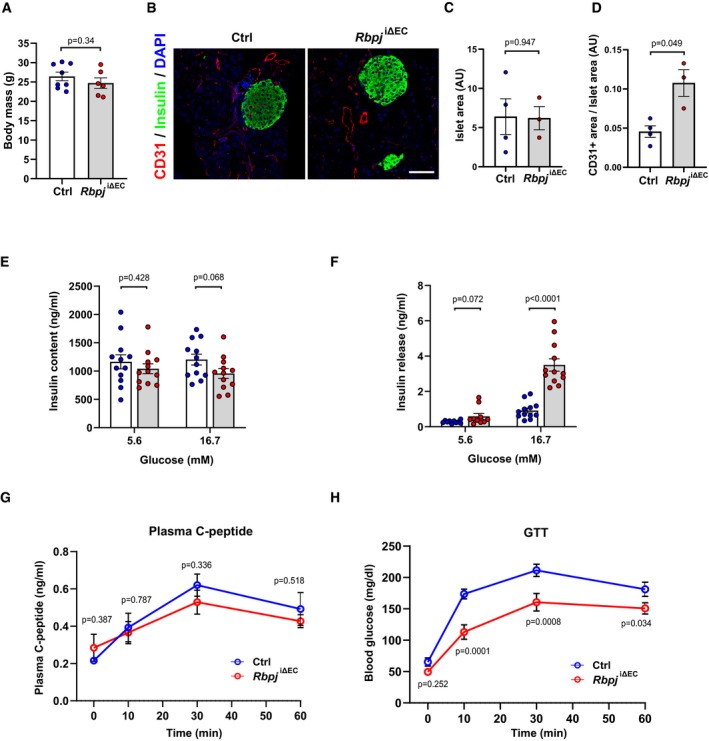
Figure EV3. Characterization of vasculature and pancreas function in Rbpj iΔ EC mice.
-
ABody mass of control (n = 8) or Rbpj iΔEC (n = 6) mice 7 weeks after tamoxifen injection. Data represent mean ± SEM, unpaired t‐test.
-
BRepresentative confocal images showing CD31+ blood vessels (red) and insulin‐positive (green) islets in pancreas sections from Rbpj iΔEC mice and littermate controls 6 weeks after tamoxifen injection. Scale bar 50 μm.
-
C, DQuantification of islet area (C) and blood vessel area (D) in control (n = 4) and Rbpj iΔEC (n = 3) mice. Data represent mean ± SEM, Welch's t‐test.
-
E, FTotal insulin content (E) and ex vivo glucose stimulated insulin secretion (F) from pancreatic islets isolated from control (n = 5) and Rbpj iΔEC (n = 4) mice. Data represent mean ± SEM, unpaired t‐test.
-
G, HPlasma C‐peptide levels (G) and blood glucose levels (H) in control and Rbpj iΔEC mice after glucose stimulation. n = 4, data represent mean ± SEM, unpaired t‐test.