-
A
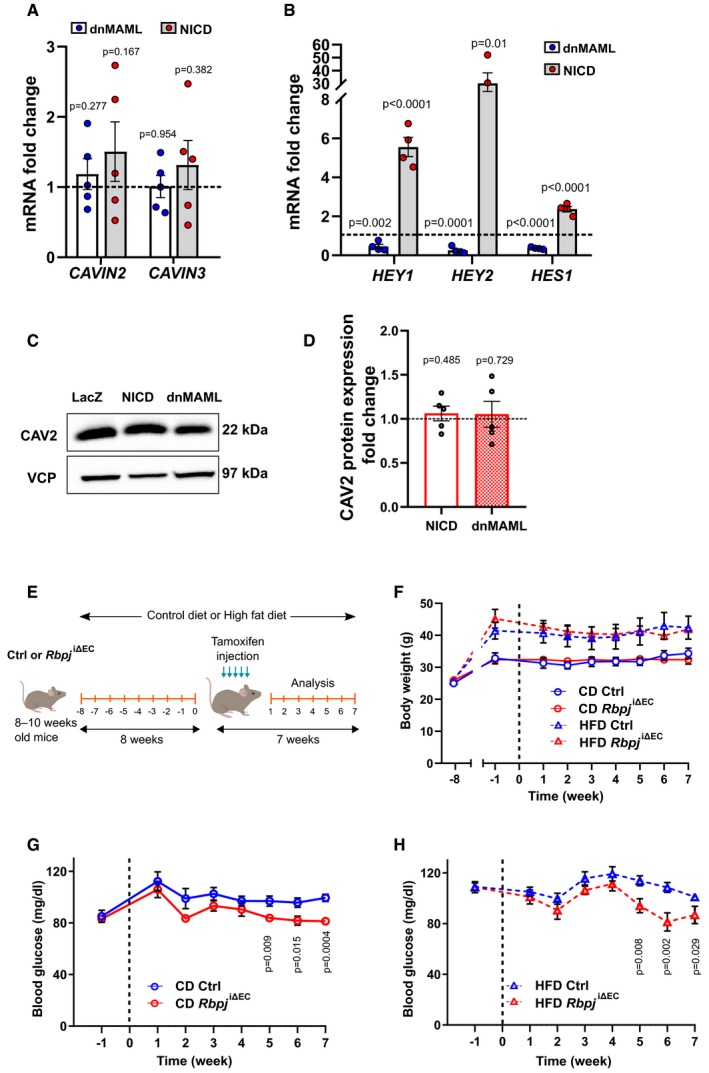
Quantitative RT–PCR detection of CAVIN2 and CAVIN3 in primary human umbilical venous endothelial cells (HUVECs) upon Notch blockade (dnMAML) and induction (NICD). n = 5, data represent mean ± SEM, unpaired t‐test.
-
B
Expression of HEY1, HEY2, and HES1 in HUVECs upon Notch manipulation. n = 4, data represent mean ± SEM, unpaired t‐test.
-
C
Representative Western blot of CAV2 expression in HUVECs upon Notch manipulation.
-
D
Densitometric analysis of Western blot in (C). Data represented as fold change over LacZ control. n = 5, data represent mean ± SEM, unpaired t‐test.
-
E
Schematic illustration of feeding and recombination protocol.
-
F
Weight curve of control or Rbpj
iΔEC mice kept on control diet (CD, 10% fat, 70% carbohydrates) or high‐fat diet (HFD, 60% fat, 20% carbohydrates). n = 4 control CD, n = 5 Rbpj
iΔEC CD, n = 6 control HFD, n = 4 Rbpj
iΔEC HFD, data represent mean ± SEM.
-
G
Blood glucose levels of control (n = 9) or Rbpj
iΔEC (n = 9) mice kept on CD. Data represent mean ± SEM, unpaired t‐test.
-
H
Blood glucose levels of control (n = 11) or Rbpj
iΔEC (n = 10) mice kept on HFD. Data represent mean ± SEM, unpaired t‐test.

