-
A
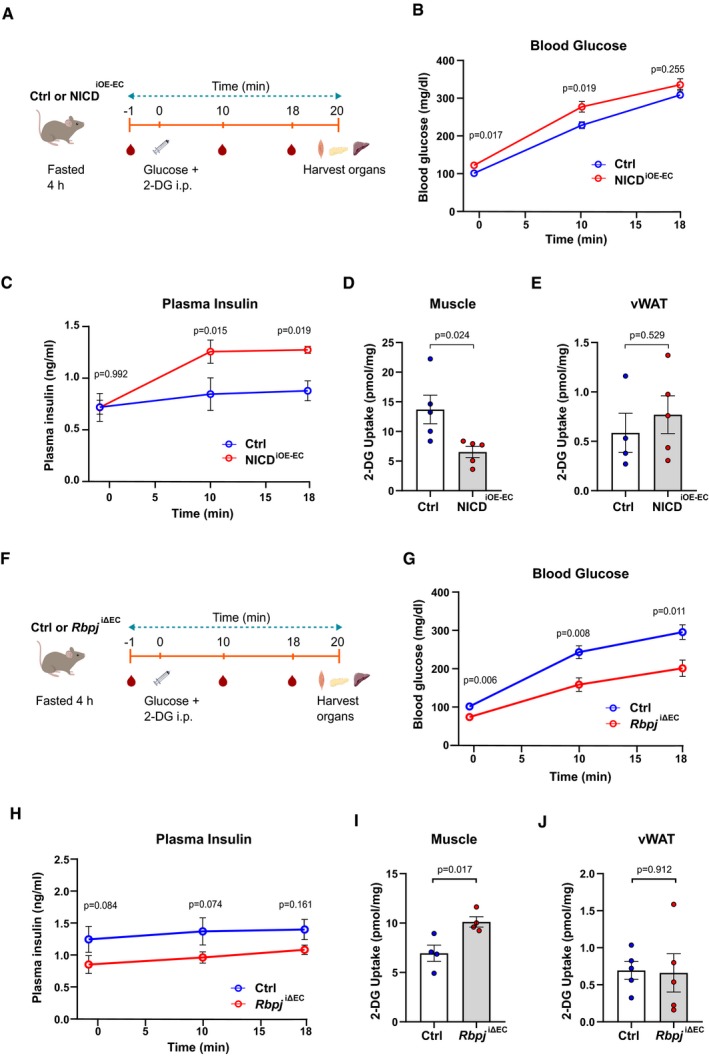
Schematic illustration of 2‐DG uptake assay protocol for control and NICDiOE‐EC mice.
-
B
Blood glucose levels of control and NICDiOE‐EC mice during the 2‐DG uptake assay. n = 5, data represent mean ± SEM, unpaired t‐test.
-
C
Plasma insulin levels of control and NICDiOE‐EC mice during the 2‐DG uptake assay. n = 5, data represent mean ± SEM, unpaired t‐test.
-
D
2‐DG uptake levels in skeletal muscle of control and NICDiOE‐EC mice. n = 5, data represent mean ± SEM, unpaired t‐test.
-
E
2‐DG uptake levels in visceral white adipose tissue (vWAT) of control (n = 4) and NICDiOE‐EC (n = 5) mice. Data represent mean ± SEM, unpaired t‐test.
-
F
Schematic illustration of 2‐DG uptake assay protocol for control and Rbpj
iΔEC mice.
-
G
Blood glucose levels of control and Rbpj
iΔEC mice during the 2‐DG uptake assay. n = 5, data represent mean ± SEM, unpaired t‐test.
-
H
Plasma insulin levels of control and Rbpj
iΔEC mice during the 2‐DG uptake assay. n = 5, data represent mean ± SEM, unpaired t‐test.
-
I
2‐DG uptake levels in skeletal muscle of control and Rbpj
iΔEC mice. n = 4, data represent mean ± SEM, unpaired t‐test.
-
J
2‐DG uptake levels in vWAT of control and Rbpj
iΔEC mice. n = 5, data represent mean ± SEM, unpaired t‐test.