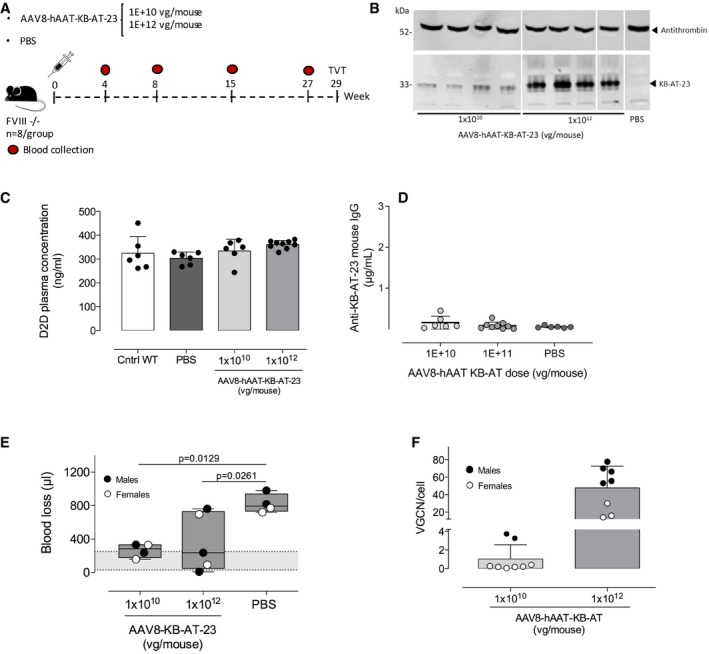
Figure 5. Long‐term safety and efficacy of KB‐AT‐23 delivered via AAV vectors in hemophilia A mice.

- Scheme representing the study design. FVIII‐deficient mice (FVIII −/−, n = 6–9/group) were administered with 2 doses (1 × 10¹⁰ or 1 × 10¹² vg/mouse) of AAV vector. Control mice were injected with PBS. Red symbols represent timing of blood collection.
- Representative Western blot analyses of KB‐AT‐23 and antithrombin expression on plasma samples (n = 4) collected from animals 27 weeks post‐AAV injection. kDa, molecular weight marker.
- Measurement of D‐dimers (D2D) plasma concentration 27 weeks post‐vector administration. Data are presented as mean ± SD (n = 6–9/group).
- Measurement of anti‐KB‐AT‐23 mouse IgG in plasma samples collected from mice (n = 6–9/group) 8 weeks post‐AAV administration. Data represent mean ± SD.
- TVT test on males and females (n = 4–5 per group) performed 29 weeks post‐vector administration. The volume of blood loss (μl) during 30 min of observation time is reported. The gray area represents the range of blood loss in FVIII‐treated mice (33–245 μl), which is similar to that of wild‐type C57BL/6 mice (49–308 μl; Johansen et al, 2016). Boxes represent 25–75% quartiles; the central line indicates the median. Whiskers span min to max. Data were analyzed via 1‐way ANOVA with Dunnett's correction for multiple comparisons.
- Vector genome copy number (VGCN) per cell in liver samples collected at sacrifice (n = 8/group). Data represent mean ± SD.
Source data are available online for this figure.
