-
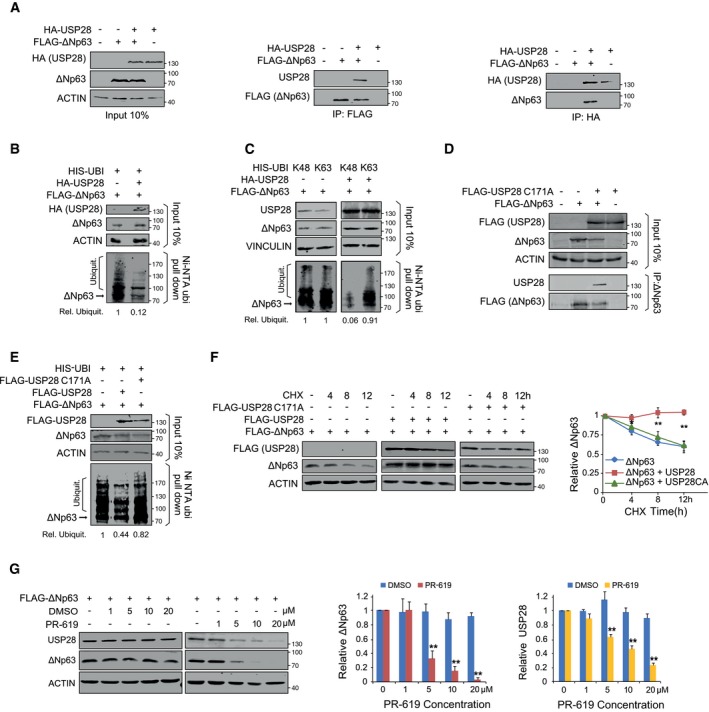
A
Co‐immunoprecipitation of exogenous HA‐USP28 and FLAG‐ΔNp63 in HEK293 cells. Either HA‐USP28 or FLAG‐ΔNp63 were precipitated and blotted against FLAG‐ΔNp63 or HA‐USP28. The input corresponds to 10% of the total protein amount used for the IP (ACTIN as loading control).
-
B
Ni‐NTA His‐ubiquitin pulldown in control‐transfected or HA‐USP28‐overexpressing HEK293 cells, followed by immunoblot against exogenous ΔNp63. The input corresponds to 10% of the total protein amount used for the pulldown. Relative ubiquitination of the representative immunoblot was calculated using ACTIN for normalization.
-
C
Ni‐NTA His‐ubiquitin pulldown K48 or K63 in control and HA‐USP28‐overexpressing HEK293 cells, followed by immunoblot against exogenous ΔNp63. The input corresponds to 10% of the total protein amount used for the pulldown. Relative ubiquitination of the representative immunoblot was calculated using VINCULIN for normalization.
-
D
Co‐immunoprecipitation of exogenous FLAG‐USP28 C171A and FLAG‐ΔNp63 in HEK293 cells. ΔNp63 was precipitated and blotted against FLAG‐USP28 or ΔNp63. The input corresponds to 10% of the total protein amount used for the IP (ACTIN as loading control).
-
E
Ni‐NTA His‐ubiquitin pulldown in control‐, FLAG‐USP28‐ or FLAG‐USP28 C171A‐transfected HEK293 cells, followed by immunoblot against exogenous ΔNp63. The input corresponds to 10% of the total protein amount used for the pulldown. Relative ubiquitination of the representative immunoblot was calculated using ACTIN for normalization.
-
F
CHX chase assay (100 μg/ml) of control‐, FLAG‐USP28‐ or FLAG‐USP28 C171A‐transfected HEK293 cells for indicated time points. Representative immunoblot analysis of FLAG (USP28) and ∆Np63 as well as quantification of relative protein abundance (ACTIN as loading control).
-
G
Immunoblot of USP28 and ∆Np63 in transfected HEK293 cells upon treatment with either DMSO or indicated concentrations of PR‐619 for 24 h. Relative protein abundance was calculated ACTIN as loading control.
Data information: Western blots shown are representative of three independent experiments (
n = 3). All quantitative graphs are represented as mean ± SD of three experiments (
n = 3).
P‐values were calculated using two‐tailed
t‐test statistical analysis; *
P < 0.05; **
P < 0.01; see also
Appendix Fig S1 and
Appendix Table S3 (exact
P‐values and statistical test used).