-
A
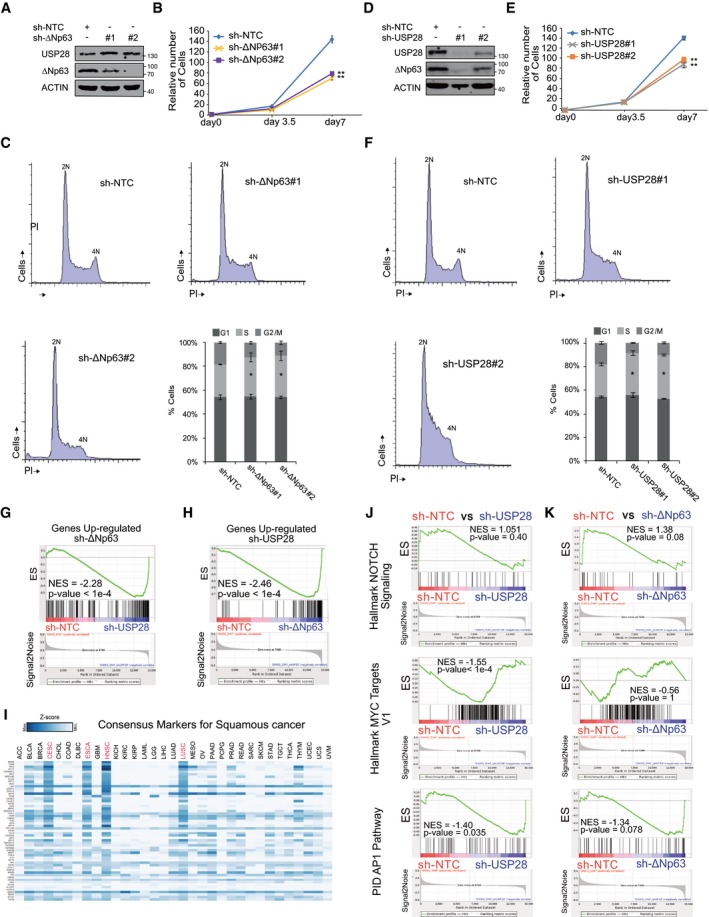
Immunoblot of endogenous ΔNp63 and USP28 in A‐431 cells stably transduced with shRNA‐non‐targeting control (NTC) and two shRNA against ΔNp63. Actin served as loading control. n = 3.
-
B
Cell growth of A‐431 cells stably transduced with shRNA‐non‐targeting control (NTC) and two shRNA against ΔNp63. Total cell number was measured in triplicate and assessed at indicated time points.
-
C
Cell cycle profile analysis by propidium iodide staining of stable ΔNp63 knock‐down A‐431 cells by two independent shRNA sequences. n = 3.
-
D
Immunoblot of endogenous ΔNp63 and USP28 in A‐431 cells stably transduced with shRNA‐non‐targeting control (NTC) and two shRNA against USP28. ACTIN served as loading control. n = 3.
-
E
Cell growth of A‐431 cells stably transduced with shRNA‐non‐targeting control (NTC) and two shRNA against USP28. Total cell number was measured in triplicate and assessed at indicated time points.
-
F
Cell cycle profile analysis by propidium iodide staining of stable USP28 knock‐down A‐431 cells by two independent shRNA sequences. n = 3.
-
G
Gene set enrichment analyses of USP28#1‐silenced A‐431 cells compared to shRNA‐NTC using the gene list: “Genes Up‐regulated sh‐ΔNp63”. NES, normalized enrichment score; P < 0.0001.
-
H
Gene set enrichment analyses of ΔNp63‐silenced A‐431 cells compared to shRNA‐NTC using the gene list: “Genes Up‐regulated sh‐USP28”. NES, normalized enrichment score; P < 0.0001.
-
I
Relative expression of consensus markers for squamous cancer, as used in Fig
4, in a pan‐cancer panel (GEPIA software).
-
J
Gene set enrichment analyses of USP28‐silenced A‐431 cells compared to shRNA‐NTC using the gene list: “Hallmark NOTCH Signaling”, “Hallmark MYC targets V1” and “PID AP1 Pathway”. NES, normalized enrichment score.
-
K
Gene set enrichment analyses of ΔNp63‐silenced A‐431 cells compared to shRNA‐NTC using the gene list: “Hallmark NOTCH Signaling”, “Hallmark MYC targets V1” and “PID AP1 Pathway”. NES, normalized enrichment score.
< 0.01. Two‐tailed
‐test. See also
‐values and statistical test used).

