-
A
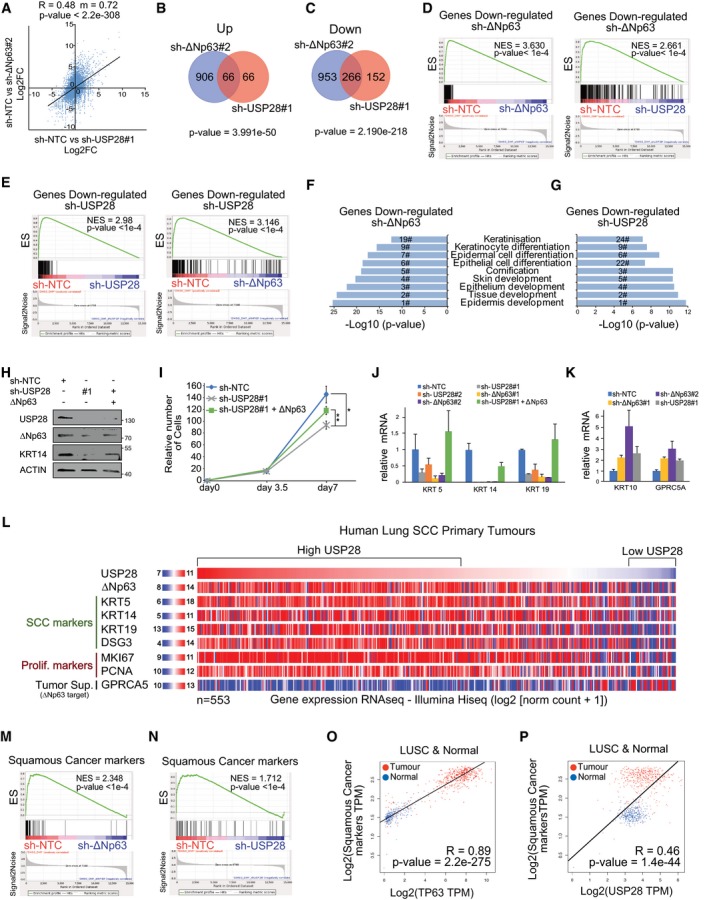
Correlation of gene expression changes upon constitutive transduction of A‐431 cells with either shRNA targeting USP28 (sh‐USP28#1) or ∆Np63 (sh‐∆Np63#2) relative to non‐targeting control (sh‐NTC). The diagonal line reflects a regression build on a linear model. R: Pearson's correlation coefficient, m: slope of the linear regression model.
-
B
Venn diagram of differentially upregulated genes (log2FC > 1.5 and q < 0.05) between sh‐∆Np63#2 and sh‐USP28#1 relative to non‐targeting control (sh‐NTC) in A‐431 cells. P‐values were calculated using a hypergeometric test.
-
C
Venn diagram of differentially downregulated genes (log2FC < 1.5 and q < 0.05) between sh‐∆Np63#2 and sh‐USP28#1 relative to sh‐NTC in A‐431 cells. P‐values were calculated using a hypergeometric test.
-
D
Gene set enrichment analysis (GSEA) of a gene set of significantly downregulated genes in sh‐∆Np63#2‐transfected A‐431 cells (“Down‐regulated sh‐ΔNP63”,
Appendix Table S1). The gene set was analysed in sh‐∆Np63#2‐ (left) and sh‐USP28#1‐depleted (right) A‐431 cells. (
N)ES: (normalized) enrichment score.
-
E
Gene set enrichment analysis (GSEA) of a gene set of significantly downregulated genes in sh‐USP28#1‐transfected A‐431 cells (“Down‐regulated sh‐USP28”,
Appendix Table S1). The gene set was analysed in shUSP28#1‐ (left) and sh‐∆Np63#‐depleted (right) A‐431 cells. (
N)ES: (normalized) enrichment score.
-
F
GO term analysis of biological processes enriched in sh‐∆Np63#2‐depleted A‐431 cells relative to sh‐NTC. Numbers indicate the ranking position of all analysed GO terms based on the significance.
-
G
GO term analysis of biological processes enriched in sh‐USP28#1‐depleted A‐431 cells relative to sh‐NTC. Numbers indicate the ranking position of all analysed GO terms based on the significance.
-
H
Immunoblot of endogenous ΔNp63 and USP28 in A‐431 cells stably transduced with constitutive shRNA‐non‐targeting control (NTC) or against USP28 and transiently transfected with exogenous ΔNp63. ACTIN served as loading control. Representative Western blot from three independent experiments.
-
I
Cell growth of A‐431 cells stably transduced with constitutive shRNA‐non‐targeting control (NTC) or against USP28 and transiently transfected with exogenous ΔNp63. Total cell number was measured and assessed at indicated time points. Quantitative graph is represented as mean ± SD of three experiments (n = 3). P‐values were calculated using two‐tailed t‐test statistical analysis. *P < 0.05, **P < 0.01.
-
J
Relative expression of SCC marker genes KRT5, KRT14 and KRT19 in A‐431 cells stably transduced with constitutive shRNA‐non‐targeting control (NTC), two independent shRNA‐ΔNp63, two independent shRNA‐USP28 or ΔNp63 in shRNA‐USP28#1, normalized to ACTIN. Quantitative graph is represented as mean ± SD of three experiments (n = 3).
-
K
Relative expression of epithelial marker genes KRT10 and GPCR5A in A‐431 cells stably transduced with constitutive shRNA‐non‐targeting control (NTC), two independent shRNA‐ΔNp63 and shRNA‐USP28#1, normalized to ACTIN. Quantitative graph is represented as mean ± SD of three experiments (n = 3).
-
L
Genomic signature of primary human lung SCC samples comprising USP28, ∆Np63, KRT5, KRT14, KRT19, DSG3, MKI67, PCNA and GPRC5A. Samples were sorted dependent on relative USP28 expression (high to low). n = 553. Xena UCSC software.
-
M
GSEA of consensus squamous cancer marker genes (see
Appendix Table S2) in A‐431 cells stably transduced with sh‐∆Np63#2 or sh‐NTC. (N)ES: (normalized) enrichment score.
-
N
GSEA of consensus squamous cancer marker genes in A‐431 cells stably transduced with sh‐USP28#1 or sh‐NTC. (N)ES: (normalized) enrichment score.
-
O
Correlation of mRNA expression of consensus squamous cancer marker genes and TP63 in lung SCC and non‐transformed lung tissue (Normal). R: Spearman's correlation coefficient. n = 836. GEPIA software.
-
P
Correlation of mRNA expression of consensus squamous cancer marker genes and USP28 in lung SCC and non‐transformed lung tissue (Normal). R: Spearman's correlation coefficient. N = 836. GEPIA software.
‐values and statistical test used).

