-
A
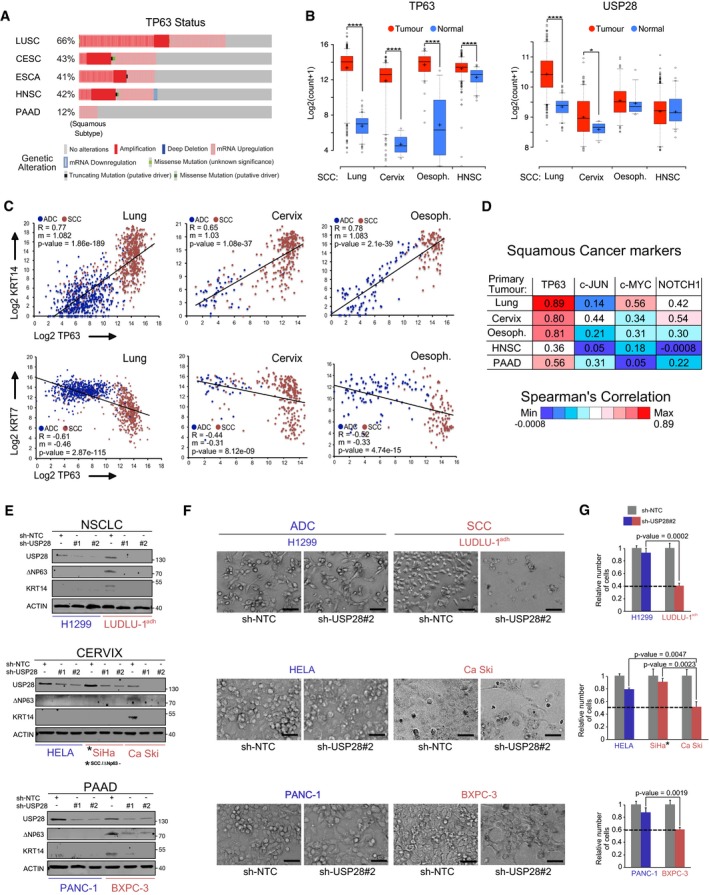
Analysis of occurring TP63 genetic alterations in lung squamous (LUSC), cervical (CESC), oesophagus (ESCA), head‐and‐neck (HNSC) and pancreatic (PAAD) tumours. CBioPortal.
-
B
Expression of TP63 (left) and USP28 (right) in human lung (n = 498), cervix (n = 254), oesophagus (n = 96) and HNSC (n = 522) SCC tumours and normal non‐transformed tissue (nLung = 338 nCervix = 3, nOesophagus = 11 and nHNSC = 44). In box plots, the centre line reflects the median, the cross represents the mean, and the upper and lower box limits indicate the first and third quartiles. Whiskers extend 1.5× the IQR. P‐values were calculated using two‐tailed t‐test statistical analysis. Xena UCSC software.
-
C
Correlation of mRNA expression of KRT14/KRT7 and TP63 in ADC and SCC tumours for lung (nADC = 513 and nSCC = 498), cervix (nADC = 47 and nSCC = 254) and oesophagus (nADC = 89 and nSCC = 96). Blue dots: ADC; red dots: SCC; R = Spearman's correlation coefficient; m: slope. Xena UCSC.
-
D
Spearman's correlation values of the gene list “Squamous cancer markers” and TP63, c‐JUN, c‐MYC or NOTCH1 in lung (n = 1,011), cervix (n = 301), oesophagus (n = 185), HNSC (n = 522) and PAAD (n = 178) tumours. Intense blue: low correlation; intense red: strong correlation. GEPIA software.
-
E
Immunoblot of control (sh‐NTC) and two independent shRNA targeting USP28 (sh‐USP28#1 and #2) for ∆Np63, KRT14 and USP28 protein abundance in H1299, LUDLU‐1adh, HeLa, SiHa, Ca Ski, PANC‐1 and BXPC‐3 (ACTIN as loading control).
-
F
Cells were seeded at equal cell density and counted after 5 days, bright‐field images of control or sh‐USP28#2‐infected H1299, LUDLU‐1adh, HeLa, Ca Ski, PANC‐1 and BXPC‐3 cells before quantification. Scale bar = 30 μm.
-
G
Relative number of H1299, LUDLU‐1adh, HeLa, Ca Ski, SiHa, PANC‐1 and BXPC‐3 sh‐USP28#2 cells compared with sh‐NTC control cells. P‐values were calculated using two‐tailed t‐test statistical analysis. SiHa* = notably, the human SCC cell line SiHa was negative for ΔNp63.
Data information: All quantitative graphs are represented as mean ± SD of three experiments (
= 3).
< 0.0001. See also
‐values and statistical test used).

