-
A
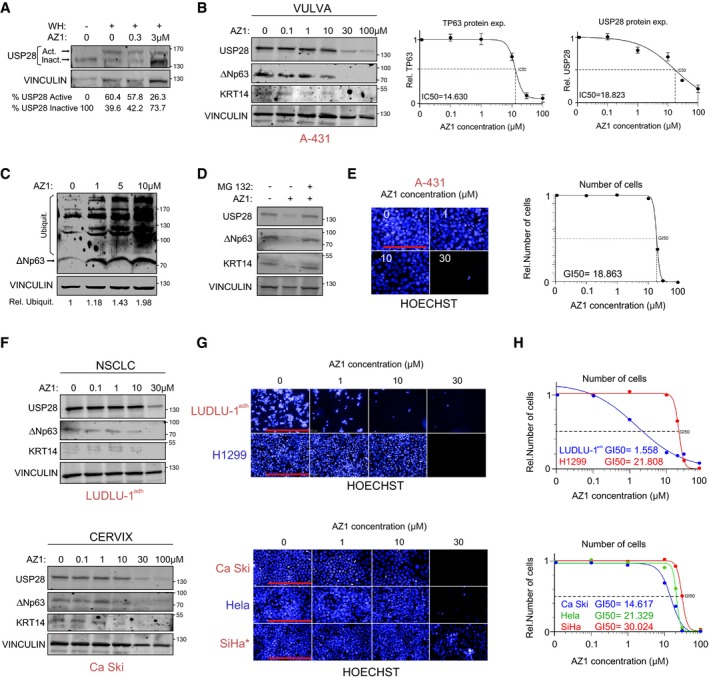
Immunoblot of endogenous USP28 in A‐431 cells upon treatment with warheads (WH) and either DMSO or indicated concentrations of AZ1 (USP28 Inh.) for 24 h. USP28 Upper band: active USP28; USP28 lower band: inactive USP28, VINCULIN as loading control.
-
B
Immunoblot of endogenous USP28, ∆Np63 and KRT14 in A‐431 cells treated for 24 h with either DMSO or indicated concentrations of AZ1. VINCULIN served as loading control. TP63 and USP28 half‐maximal inhibitory protein abundance (IC50) was calculated. Graphs are represented as mean ± SD (n = 3).
-
C
TUBE pulldown of endogenous ubiquitylated ∆Np63 in A‐431 cells upon treatment with either DMSO or indicated concentrations of AZ1 for 24 h. VINCULIN served as loading control for relative Ubiquitination.
-
D
Immunoblot of endogenous USP28, ∆Np63 and KRT14 in A‐431 cells treated for 18 h with either DMSO or 15 μM AZ1 followed by 6 h of treatment with 20 μM proteasomal inhibitor MG‐132 (20 μM) or DMSO. VINCULIN served as loading control.
-
E
A‐431 cells were seeded at equal cell density and cultured in the presence of either DMSO, 1 μM, 10 μM or 30 μM AZ1 for 48 h. Cells were quantified with the Operetta imaging system using Hoechst staining. 50% growth inhibition (GI50) was calculated. Scale bar = 250 μm. n = 30 fields analysed.
-
F
Immunoblot of endogenous USP28, ∆Np63 and KRT14 in LUDLU‐1adh, H1299, Ca Ski, HeLa and SiHa cells treated for 24 h with either DMSO or indicated concentrations of AZ1. VINCULIN served as loading control.
-
G
LUDLU‐1ADH, H1299, Ca Ski, HeLa and SiHa cells were seeded at equal cell density and cultured in the presence of either DMSO, 1, 10 or 30 μM AZ1 for 48 h. Scale bar for LUDLU‐1adh and H1299 = 500 μm. Scale bar for Ca Ski, HeLa and SiHa = 250 μm. SiHa* = notably, the human SCC cell line SiHa was negative for ΔNp63.
-
H
Number of cells was quantified with the Operetta imaging system using Hoechst staining. 50% growth inhibition (GI50) was calculated. n = 30 fields analysed.
.

