-
A
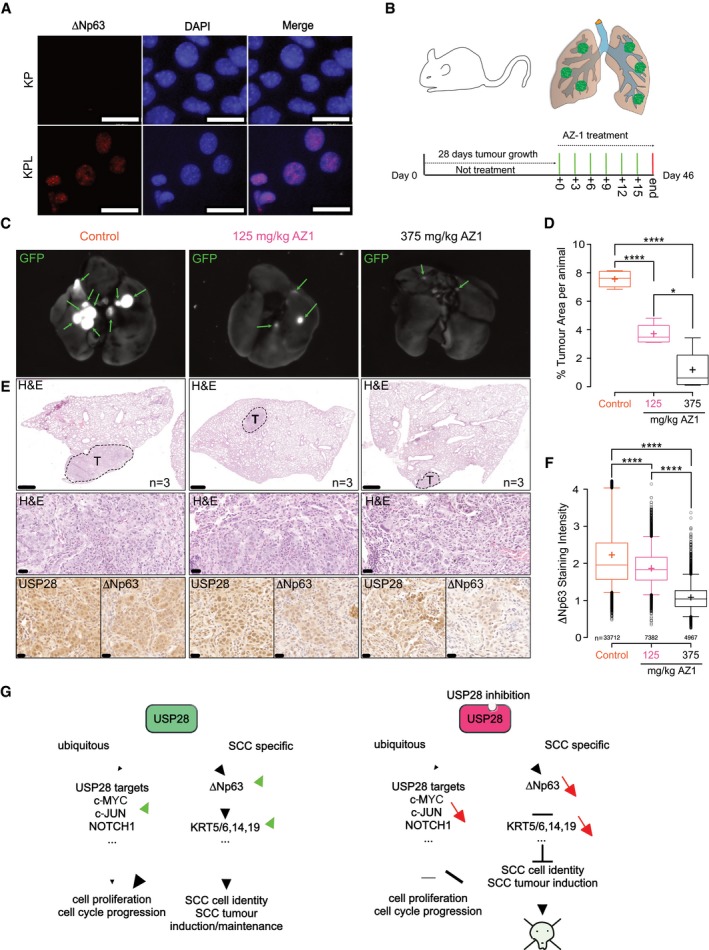
Immunofluorescence (IF) staining against endogenous ∆Np63 in KP and KPL cell lines (blue: DAPI [staining of nuclei] and red/magenta: ∆Np63), scale bar = 32 μm.
-
B
Schematic diagram of AZ1 treatment. After first 28 days without treatment, tumours were treated with an AZ1 dosage every 3 days until day 46.
-
C
GFP Fluorescent images of lungs treated with either PBS/DMSO/0.1% Tween‐80 or indicated concentrations of AZ1. Tumour cells are positive for GFP (green arrows). n = 3.
-
D
Quantification of % tumour area (normalized to total lung area) in control (n = 5), 125 mg/kg AZ1 (n = 4) and 375 mg/kg AZ1 (n = 4)‐treated animals.
-
E
Representative staining of H&E and IHC for USP28 and ∆Np63 of SCC tumours from mice treated with PBS/DMSO/0.1% Tween‐80 or indicated concentrations of AZ1. Boxes indicate highlighted tumour areas. First‐line scale bars = 500 μm; lower scale bars = 20 μm. n = 3.
-
F
∆Np63 staining intensity of lung tumours treated with PBS/DMSO/0.1% Tween‐80 or indicated concentrations of AZ1. nControl = 33,712 cells; nAZ1 125 mg/kg = 7,382 cells; nAZ1 375 mg/kg = 4,967 cells. Cells were analysed from three independent animals.
-
G
Schematic model.
Data information: In box plots, the centre line reflects the median, the cross represents the mean, and the upper and lower box limits indicate the first and third quartiles. Whiskers extend 1.5× the IQR.
P‐values were calculated using two‐tailed
t‐test. *
P < 0.05; ****
P < 0.0001. See also Fig
EV5 and
Appendix Table S3 (exact
P‐values and statistical test used).
Source data are available online for this figure.

