
Figure 13.
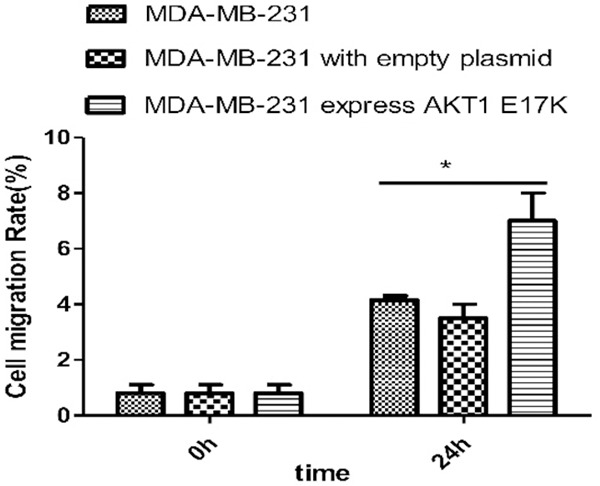
Image J software for statistical cell migration test results. Cell migration rate (%) was calculated by Image J software. The cell mobility of MDA-MB-231 cells expressing AKT1 E17K mutant gene was higher than that of wild-type cells (*P < 0.05).