
Figure 2.
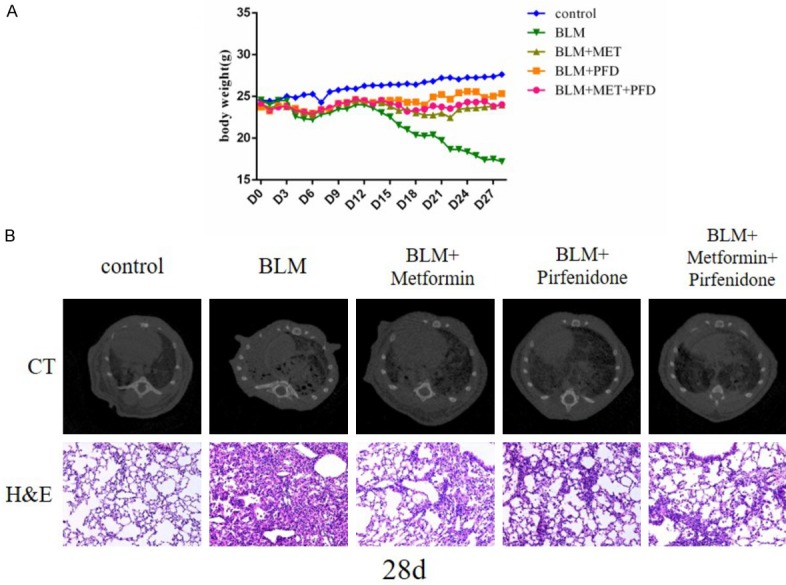
A. The average body weight of the control group, BLM group, BLM + metformin group, BLM + pirfenidone group, BLM + metformin + pirfenidone group from day 0 to day 28. There is little difference between BLM group and BLM + drugs groups from day 0 to day 7. After metformin and pirfenidone applied, the loss of body weight in BLM + metformin group, BLM + pirfenidone group and BLM + metformin + pirfenidone group is significantly reduced. B. Computed Tomography of Chest scan (upper panel) and photomicrographs (original magnification 200×) of H&E staining (lower panel) of lung sections of mice at day 28. The five columns are the control group, BLM group, BLM + metformin group, BLM + pirfenidone group, BLM + metformin + pirfenidone group, respectively.