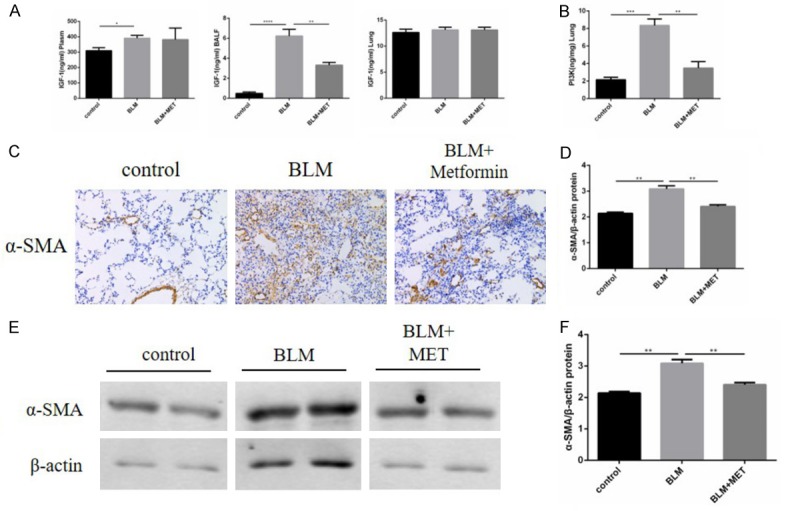
Figure 4.

A, B. The level of IGF-1 in mouse plasma, BALF and lung tissues as well as its main downstream cytokine PI3K content in mouse lungs were measured by ELISA, results are expressed as mean ± SEM, n = 4-6 mice per group, *P<0.05 **P<0.01 ***P<0.001 ****P<0.0001. C. Immunohistochemical staining of α-SMA in mouse lungs at day 28, original magnification 200×. The three columns are the control group, BLM group, BLM + metformin group, respectively. D. Statistical results of α-SMA staining were shown as positive area ratio total area, and results are expressed as mean ± SEM, n = 4-6 mice per group, **P<0.01. E, F. Whole lung tissues western blotting of α-SMA at day 28 and the statistical chart of it, results are expressed as mean ± SEM, n = 4-6 mice per group, **P<0.01.
