Figure 10.

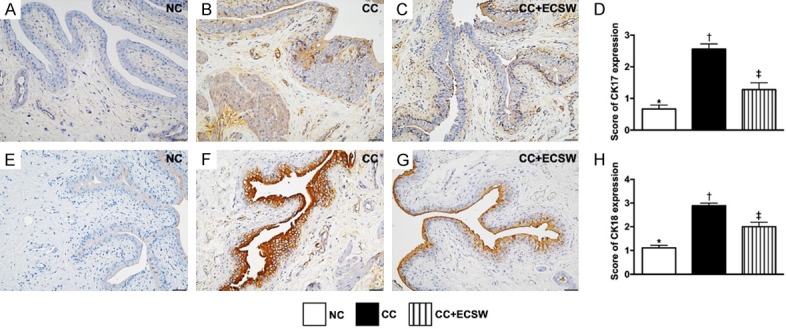
Expressions of cytokeratin (CK)17+ and CK18+ cells in urinary bladder at day 60 after CC induction. A-C. Illustrating microscopic finding (400 ×) of immunohistochemical (IHC) staining for identification of the expression of CK17 (gray color) in urinary bladder by day 60 after CC induction. D. Analytical result of CK17 expression by day 60 after CC induction, * vs. other groups with different symbols (†, ‡), P < 0.0001. E-G. Illustrating IHC microscopic finding (400 ×) for identification of the expression of CK18 (brown color) in urinary bladder by day 60 after CC induction. H. Analytical result of CK18 expression by day 60 after CC induction, * vs. other groups with different symbols (†, ‡), P < 0.0001. Scale bars in right lower corner represent 20 µm. All statistical analyses were performed by one-way ANOVA, followed by Bonferroni multiple comparison post hoc test (n = 6 for each group). Symbols (*, †, ‡) indicate significance at the 0.05 level. NC = normal control; CC = chronic cystitis; ECSW = extracorporeal shock wave.
