
Figure 2.
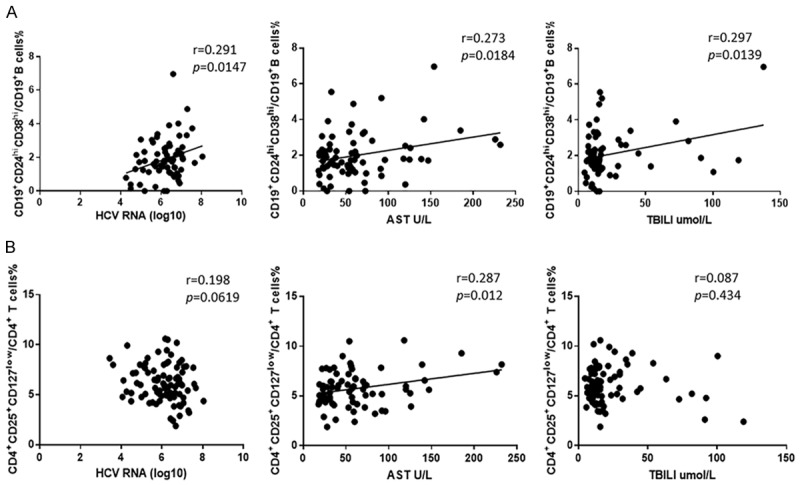
Correlation analysis between CD19+CD24hiCD38hi regulatory B cells or CD4+CD25+CD127low regulatory T cells and clinical parameters. A. The proportion of CD19+CD24hiCD38hi regulatory B cells was positively correlated with HCV RNA loads (r = 0.291, P = 0.0147, N = 83) (left) and sera AST levels (r = 0.273, P = 0.0184, N = 87) (middle) and sera total bilirubin levels (r = 0.297, P = 0.0139, N = 70) (right). B. The proportion of CD4+CD25+CD127low regulatory T cells was not associated with HCV RNA loads (r = 0.198, P = 0.0619, N = 90) (left) and sera total bilirubin levels (r = 0.087, P = 0.434, N = 83) (right), but positively correlated with sera AST levels (r = 0.287, P = 0.0012, N = 91) (middle). Statistical analyses were performed using linear regression analysis.