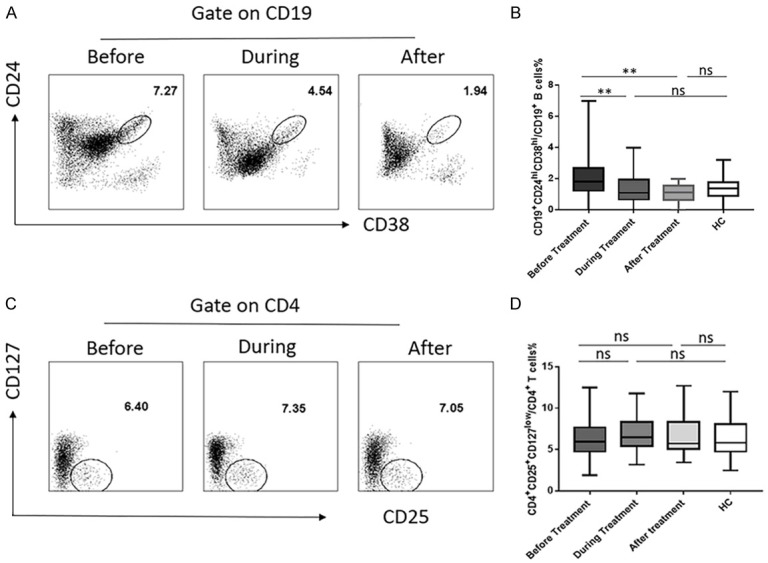
Figure 4.

The dynamic changes of the CD19+CD24hiCD38hi regulatory B cells and CD4+CD25+CD127low regulatory cells in HCV-infected patients with DAA treatment. (A) Change of the CD19+CD24hiCD38hi regulatory B cells before (N = 97), during (N = 34), and after DAA (N = 16) treatment and (B) statistical chart. (C) Change of the CD4+CD25+CD127low regulatory cells before (N = 99), during (N = 67) and after DAA (N = 22) treatment and (D) statistical chart. Values were Mean ± SEM. Statistical analyses were performed using one-way ANOVA. *: P<0.05, **: P<0.01, ***: P<0.001, ns, not significant.
