Figure 2.

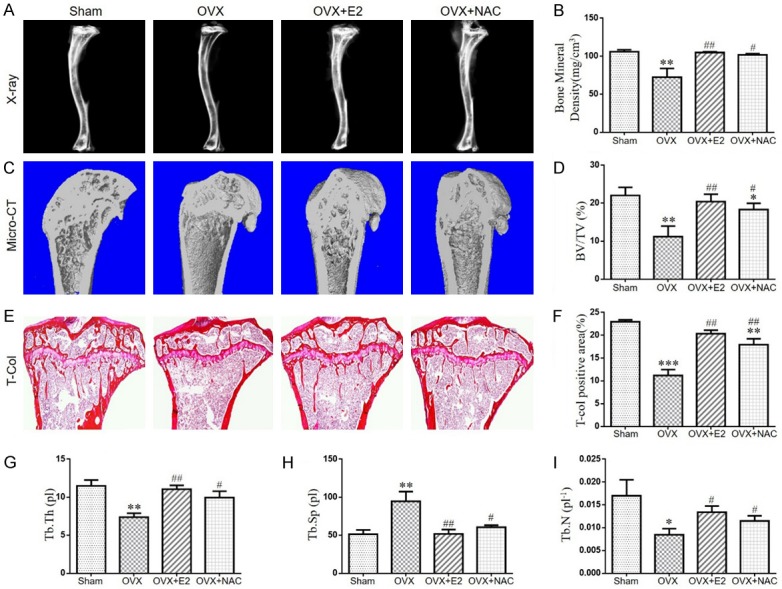
The effect of E2 or NAC on the bone mineral density and bone volume in ovariectomized mice. (A) Representative radiographs of tibias from 16-week-old mice of each group. (B) Bone mineral density analysis of the trabecular bone. (C) Representative Micro-CT-scanned and 3D reconstructed sections along the longitudinal direction of tibias. (D) Trabecular bone volume relative to tissue volume (BV/TV, %). (E) Representative micrographs of paraffin sections of tibias were stained histochemically for total collagen. (F) Total collagen positive area (%). (G) Thickness of trabecular bone (Tb.Th), (H) Trabecular separation (Tb.Sp), (I) Trabecular number (Tb.N) as analyzed with Micro-CT SkyscanCTAn software. Data are presented as the mean ± SEM of determinations, each data-point was the mean of five specimens. *P<0.05, **P<0.01, ***P<0.001, versus sham mice. #P<0.05, ##P<0.01 versus OVX mice. (E) Magnification, 50×.
