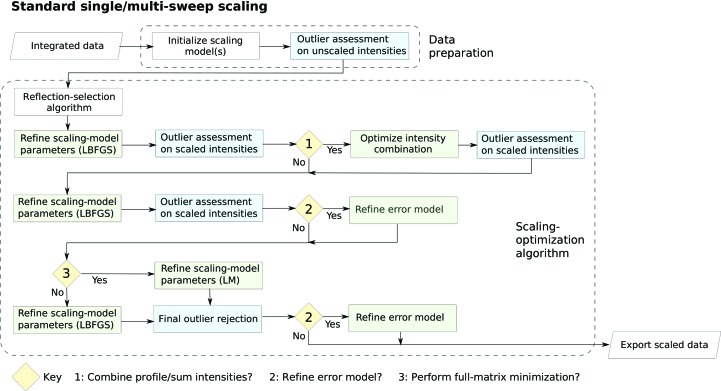
Figure 2.
Flow chart showing the main processes of the default scaling algorithm, which consists of several rounds of model optimization and outlier rejection, as well as optimization of profile and summation intensity combination and adjustment of uncertainty (error) estimates by refining a two-parameter error model.

