Fig. 2.
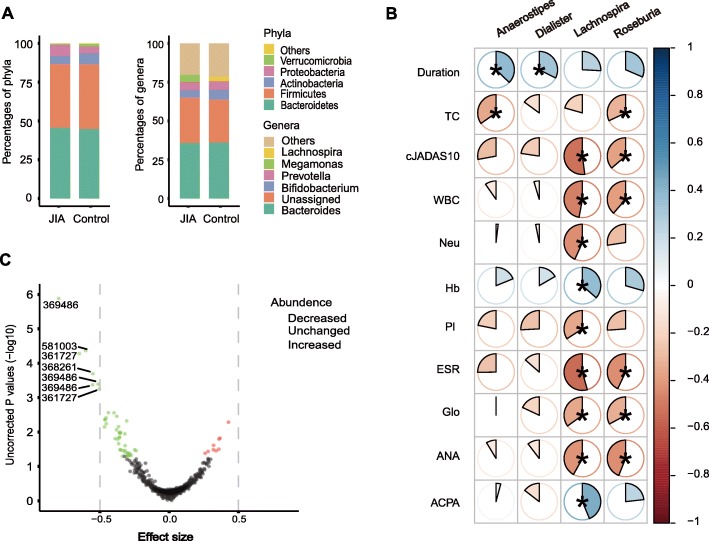
The compositional differences at phylum, genus, and OTU levels, and associations between genera and clinical indices. a The compositional differences of the phyla and genera between the two groups. b Associations between the relative abundance of the 4 genera and clinical indices. A pie chart with an asterisk indicates that the correlation coefficient reached significance after the P-value was adjusted. c Volcano plot of the OTUs. Green and red points represent the sample of those with P-values < 0.05 by Wilcoxon test (unadjusted P-values). The green and red colors indicate a decrease and increase in abundance, respectively. The effect size is the ratio of “the difference between groups” and “the maximum difference within groups.” In general, the effect size cut-off is more robust than P-values. The OTUs are considered biological markers if their absolute values of effect size are ≥0.5. Seven OTUs, marked with OTU numbers, have absolute values > 0.5, including the five OTUs identified by Wilcoxon test (Additional file 2: Table S8). ACPA: Anti-citrullinated protein antibody; ANA: Antinuclear antibody; cJADAS10: Clinical juvenile arthritis disease activity score 10; Duration: Disease duration; ESR: Erythrocyte sedimentation rate; Glo: Globulin; Hb: Hemoglobin; Pl: Platelet; TC: Total cholesterol; WBC: While blood cell; Neu: Neutrophil

