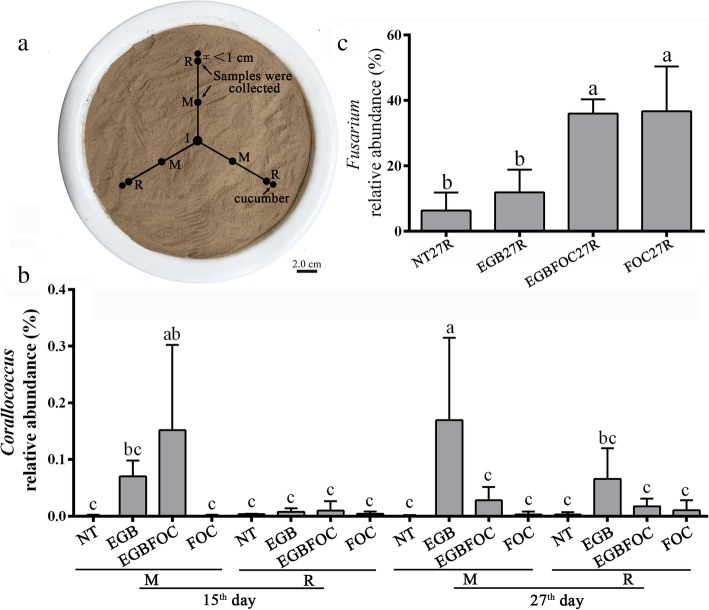
Fig. 2.
Sampling strategy (a) and relative spatiotemporal abundances of Corallococcus (b) and Fusarium (c). I, Strain EGB inoculation site; R, the sampling site surrounding the roots; M, a site between the cucumber root and inoculation site; NT, no FOC or strain EGB solid culture; EGB, strain EGB solid culture only; EGBFOC, both FOC and EGB solid culture; FOC, FOC only. Each sample had 3 repeats, and the bars represent the standard deviations of averages from three replicates. Values designated with the same letters were not significantly different (p ≤ 0.05) according to Duncan’s test

