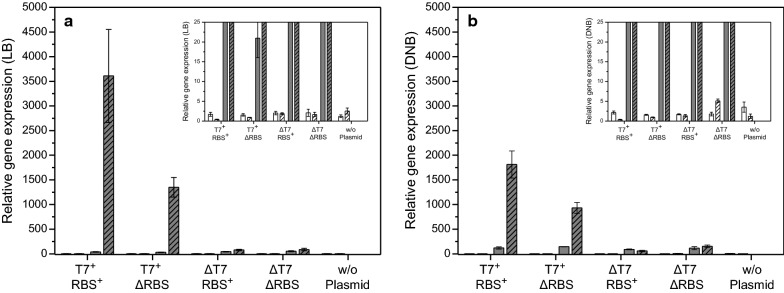
Fig. 4.
hFGF-2 transcript levels under inducing and non-inducing conditions. a Transcript levels in E. coli BL21(DE3) transformed with expression vectors carrying the gene encoding hFGF-2 in shake-flask cultures with a Luria–Bertani (LB) medium or b defined glucose-supplemented mineral salt medium (DNB). Trancripts of genes encoding the major elongation factor EF-Tu (white bars) and hFGF-2 (gray bars) are shown in non-induced cells (open bars) and 4 h after IPTG induction (hatched bars). T7+ RBS+: cells containing the expression vector with promoter and with RBS in front of the hFGF-2 gene; T7+ ΔRBS: with promoter but without RBS; ΔT7 RBS+: without promoter but with RBS; ΔT7 ΔRBS: without promoter and without RBS; w/o plasmid: E. coli BL21(DE3) without expression vector. The inserts depict the same data as the main figures only at different scale. Transcripts of rrsH, were used as internal standard and artificially defined as 10,000. Data are presented as mean ± SD, n = 4

