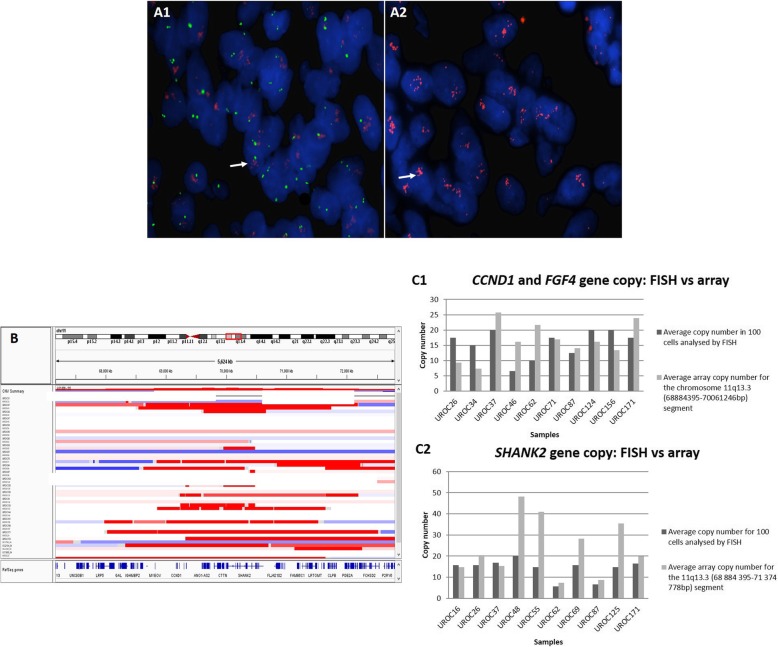
Fig. 2.
CCND1/FGF4 and SHANK2 genes copy number. (A) DAPI stained nuclei from sample UROC171. a1 FISH analysis was performed with the Vysis LSI t(11;14) dual color probe. The IGH gene probe on chromosome 14, acts as an internal control (green signal), the red signal represents locus specific probe encompassing the CCND1 and FGF4 genes). Gains are seen with 6–8 red signals (white arrow) while the control probe shows two green signals in most cells. a2 DAPI stained nuclei from UROC171 case, hybridized with the BAC clone, RP11-736 L3 (SHANK2 gene), labeled with SpectrumOrange-dUTP (Abbott Molecular, USA). Clumping of red signals for SHANK2 (white arrow), were consistent with high-level gains. This type of signal pattern was approximated to 20 signals. b 500 K SNP copy number segmentation for chromosome 11q in all samples generated in GenePattern (IGV). The minimal common region of gain (11q13.3: 69889604–70,002,885) is represented by the red box. This region includes the CTTN, PPFIA1 and SHANK2 genes. c Graphs showing the average copy number of CCND1 and SHANK2 for each of the 10 samples analyzed by FISH. c1 The average CCND1 copy number across 10 samples was 15.7 by FISH and 16,5 by copy number array analysis (11q: 68884395-70,061,246 bp) in the same cases. c2 Gain of SHANK2 was confirmed by FISH in 10 cases (average of 14,2 copies), the same cases had an average copy number of 23,5 by array copy number (11q:70,061,246-70,310,057)

