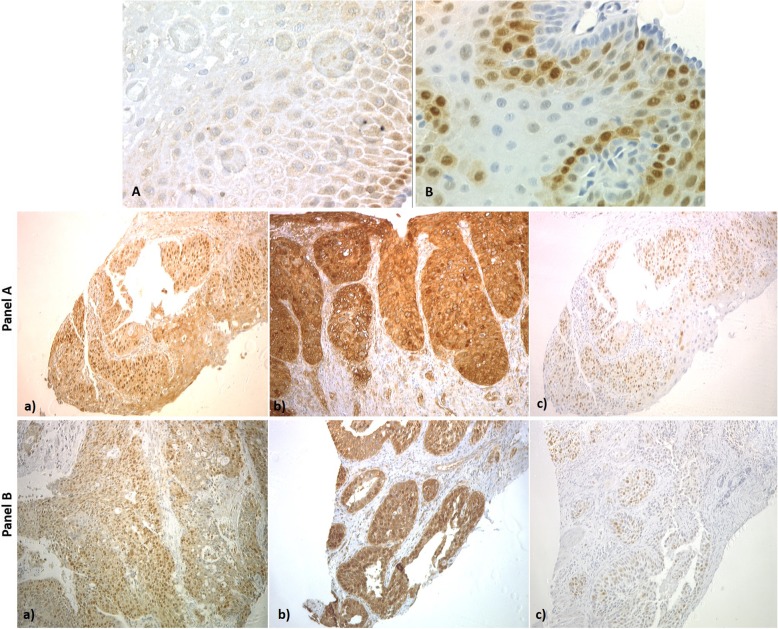
Fig. 3.
Representative images of the common immunohistochemical staining patterns for Shank2, cortactin and cyclin D1. a shows Shank2 staining (40x magnification) in non-neoplastic oesophageal squamous mucosa, cytoplasmic signal was observed in basal cells, which disappeared towards the luminal surface. b shows staining of CCND1 in non-neoplastic oesophageal squamous mucosa (40x magnification), staining was observed in nuclei, which disappeared towards the luminal surface. Panel A: Case UROC48 with co-amplification of the SHANK2, CTTN and CCND1 genes. a) shows intense cytoplasmic staining for Shank2 (score 3). b) intense cytoplasmic and membranous staining for cortactin (score 3). c) Moderate staining for cyclin D1 (score 1). Panel B: Case UROC144 with amplification of the SHANK2 gene only. a) shows intense cytoplasmic staining for Shank2 (score 3), b) shows intense cytoplasmic staining for cortactin (score 3) and c) shows moderate staining for cyclin D1 (score 2)

