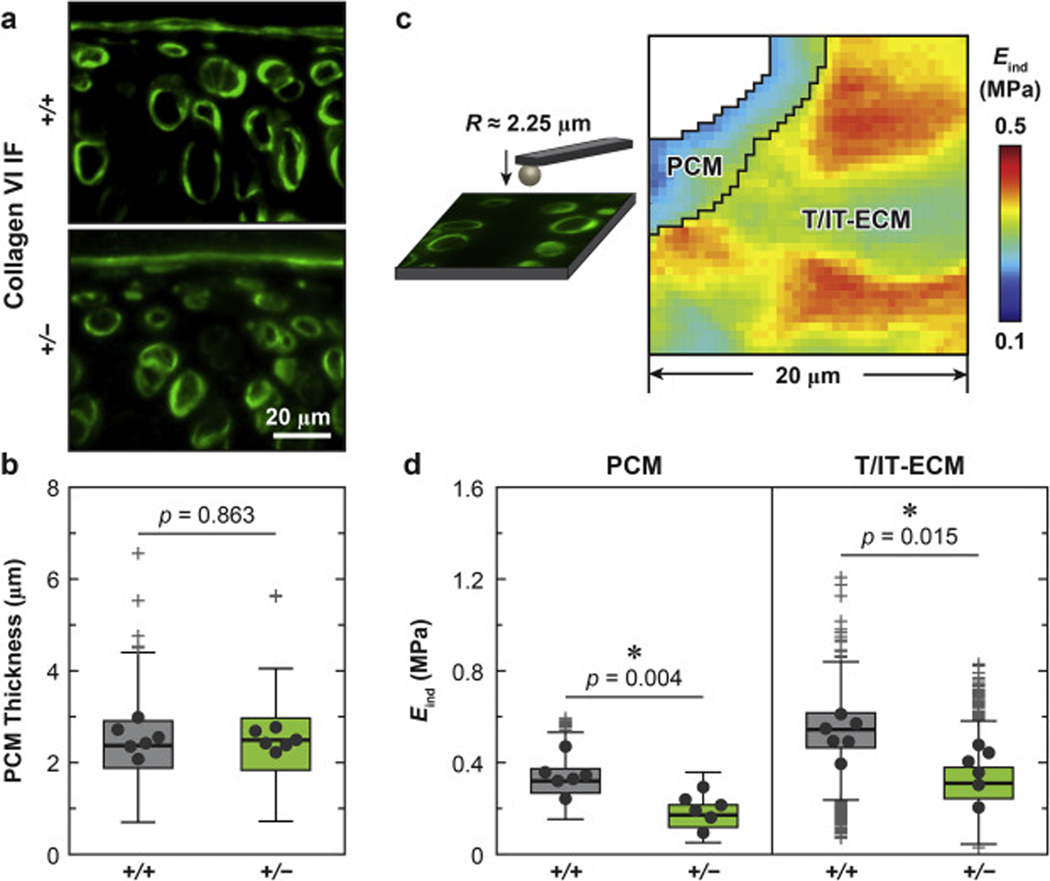
Figure 3.
Impact of collagen III reduction on the micromechanical properties of articular cartilage PCM and T/IT-ECM. a) Representative collagen VI IF images of 2-month-old wild-type (+/+) and Col3a1+/– (+/−) tibia cartilage sagittal sections. b) Box-and-whisker plots of the distribution of cartilage PCM thickness (≥ 120 cells from n = 6 animals for each genotype, p-value was obtained via unpaired two-sample student’s t-test on the PCM thickness values pooled from the six animals). c) Schematics of collagen VI IF-guided AFM-nanoindentation mapping experimental set-up and representative map of indentation modulus, Eind, from 2-month-old WT cartilage, which illustrated the separation of the PCM and T/IT-ECM microdomains. d) Box-and-whisker plot of Eind distribution on the PCM (≥ 600 locations from n = 6 animals for each genotype) and T/IT-ECM (≥ 2,800 locations, n = 6, p-values were obtained via Mann-Whitney test on the averaged modulus from each animal). Panels b, d: Each data point represents the average value measured from one animal.

