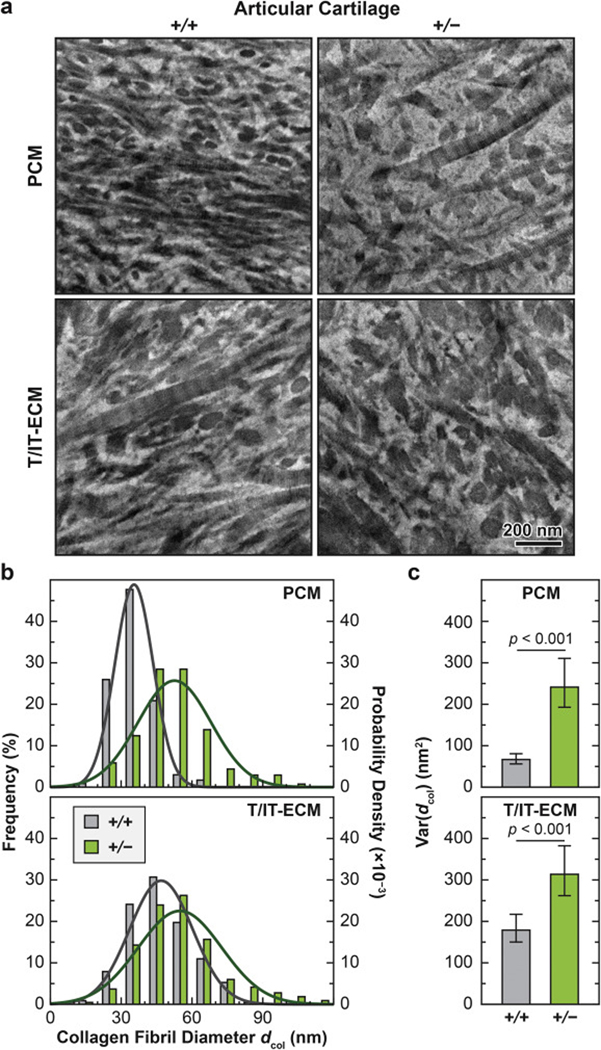
Figure 5.
Impact of collagen III reduction on the nanostructure of collagen fibrils in the PCM and T/IT-ECM of articular cartilage. a) Representative TEM images of collagen fibril structure on the sagittal sections of 2- month-old wild-type (+/+) and Col3a1+/– (+/−) cartilage PCM and T/IT-ECM. b) Histogram of fibril diameter distribution (> 130 fibrils from n = 4 animals for each genotype in each region). Shown together were the normal distribution, N (μ, σ2), fits to fibril diameters (for each fit, values of μ and σ correspond to the mean and standard deviation of fibril diameters shown in Table 2). c) Comparison of fibril diameter heterogeneity (variance) between the two genotypes (mean ± 95% CI, > 130 fibrils, n = 4).

