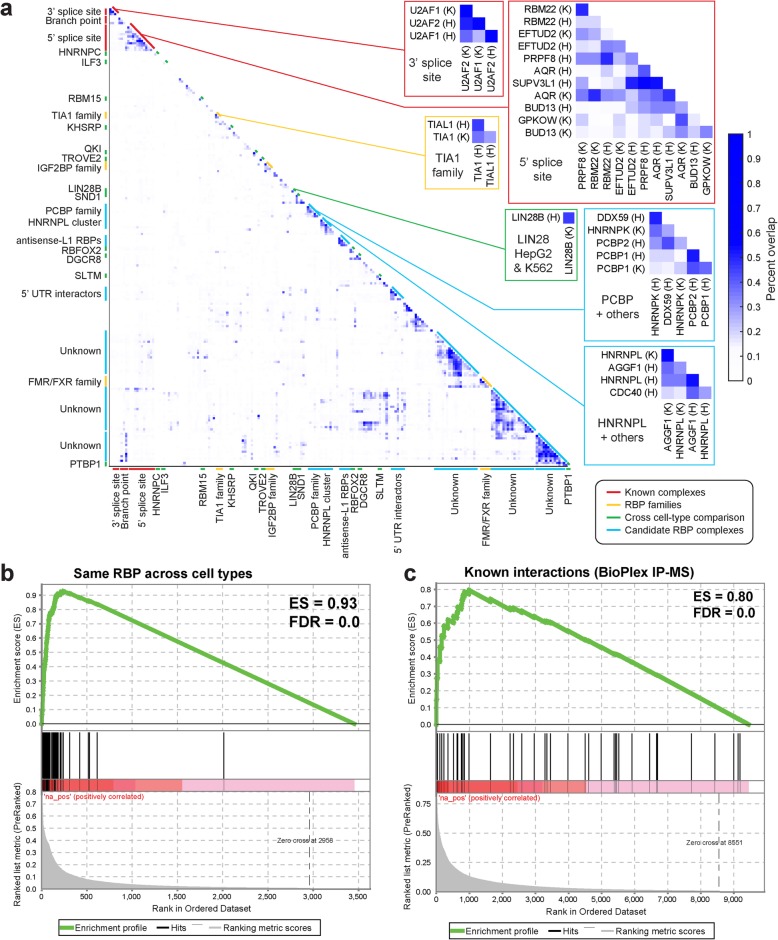
Fig. 8.
RBP co-association predicts known and novel RNP complexes. a Heatmap indicates the pairwise fraction of eCLIP peaks overlapping between datasets. Callout examples are shown for known complexes, RBP families, same RBP profiled across cell types, and putative novel complexes. b GSEA analysis comparing the fraction overlap observed profiling the same RBP in both K562 and HepG2, compared against random pairings of RBPs (with one profiled in K562 and the other in HepG2). c As in b, but using the set of RBPs with interactions reported in the BioPlex IP-mass spectrometry database [52]

