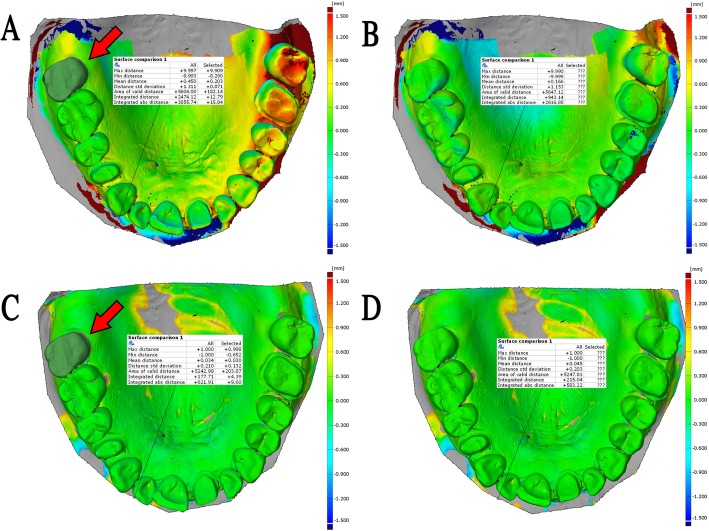
Fig. 4.
Full arch surface comparison of two selected scans from Planscan (a, b) or Physical impression (c, d) group. a In the case of local best fit at scanning origin (red arrow, tooth 15), the surface deviation on the tooth 15 was 87 μm, where on the whole arch, it was 688 μm. b In the case of best fit on the full arch (conventional method), the surface deviation on the whole arch was 463 μm. c In the case of local best fit at scanning origin (red arrow, tooth 15), the surface deviation on tooth 15 was 47 μm, where on the whole arch, it was 119 μm. d In the case of best fit on the full arch (conventional method), the surface deviation on the whole arch was 111 μm. The scale of color bars set equally on each figure. Little difference can be seen between b and d figures contrary to the differences between a and c, indicating the importance of the scan origin

